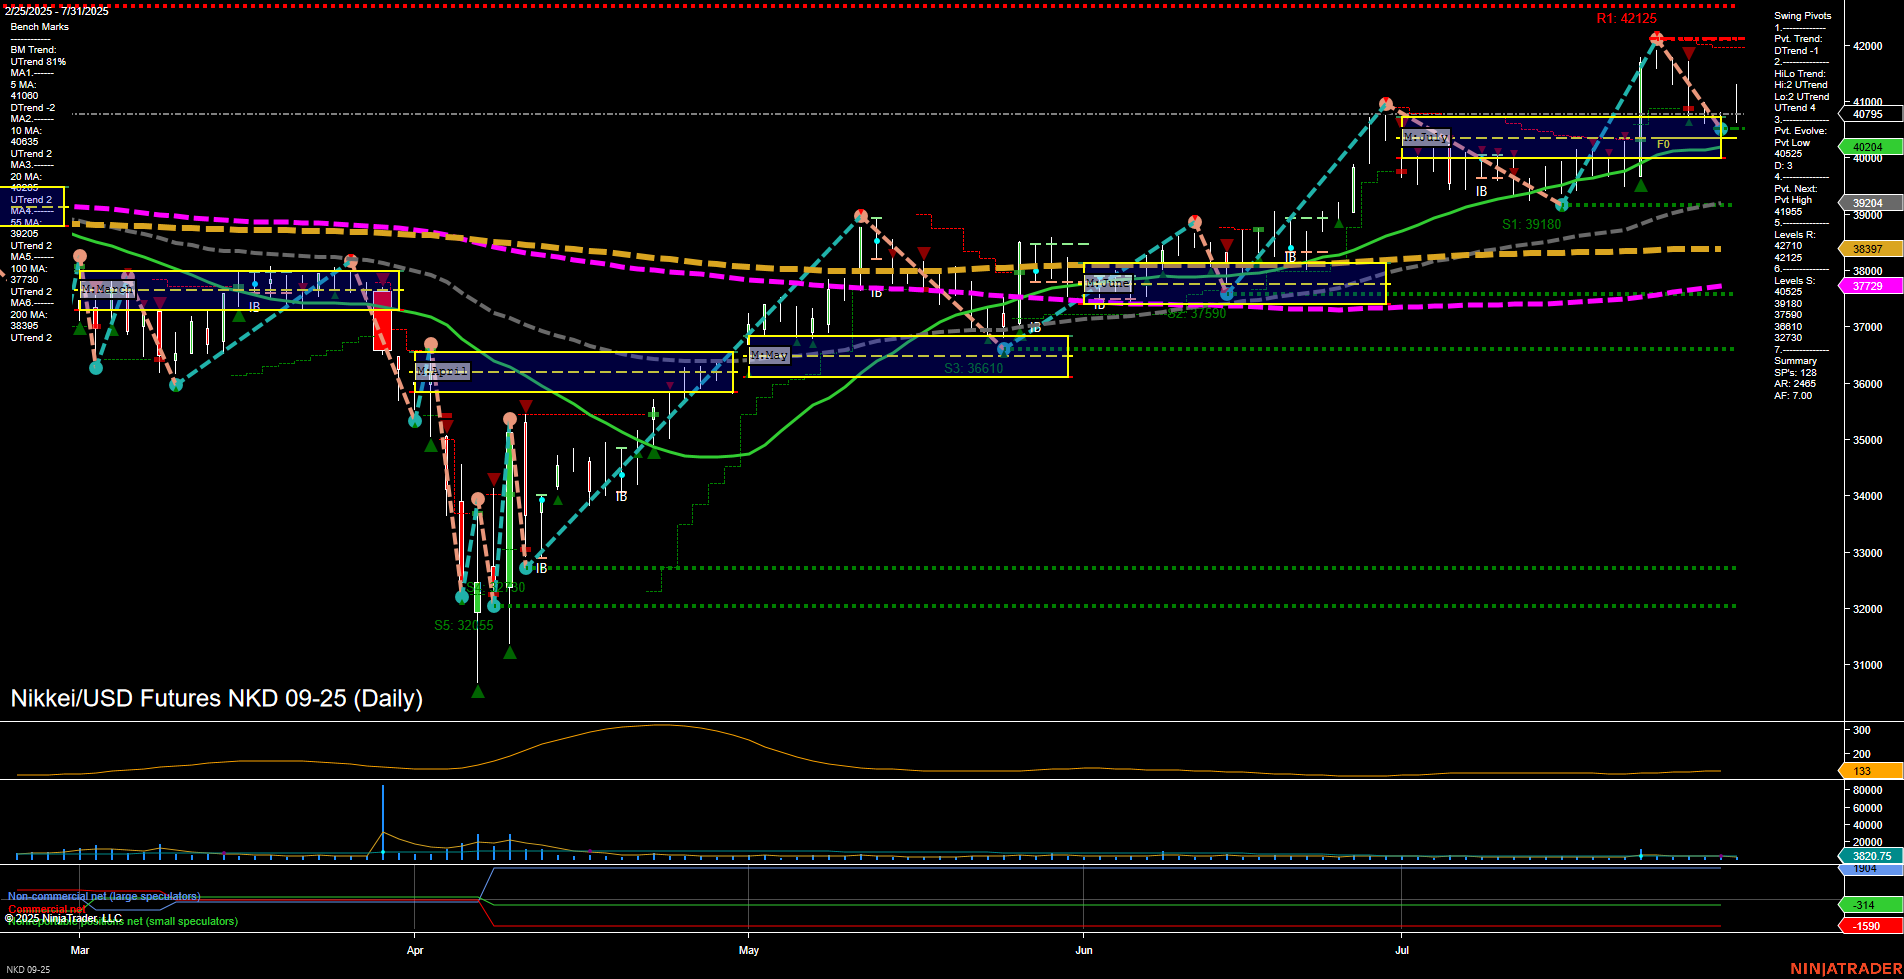
NKD Nikkei/USD Futures Daily Chart Analysis: 2025-Aug-01 07:12 CT
Price Action
- Last: 40204,
- Bars: Medium,
- Mom: Momentum slow.
WSFG Weekly
- Short-Term
- WSFG Current: -78%
- F0%/NTZ' Bias: Price Below,
- WSFG Trend: Down.
MSFG Month Aug
- Intermediate-Term
- MSFG Current: -10%
- F0%/NTZ' Bias: Price Below,
- MSFG Trend: Down.
YSFG Year 2025
- Long-Term
- YSFG Current: 5%
- F0%/NTZ' Bias: Price Above,
- YSFG Trend: Up.
Swing Pivots
- (Short-Term) 1. Pvt. Trend: DTrend,
- (Intermediate-Term) 2. HiLo Trend: UTrend,
- 3. Pvt. Evolve: Pvt Low 40052,
- 4. Pvt. Next: Pvt High 40795,
- 5. Levels R: 42125, 40795,
- 6. Levels S: 40004, 38397, 38000, 37729.
Daily Benchmarks
- (Short-Term) 5 Day: 41000 Down Trend,
- (Short-Term) 10 Day: 40355 Down Trend,
- (Intermediate-Term) 20 Day: 40225 Down Trend,
- (Intermediate-Term) 55 Day: 39180 Up Trend,
- (Long-Term) 100 Day: 37770 Up Trend,
- (Long-Term) 200 Day: 36330 Up Trend.
Additional Metrics
Recent Trade Signals
- 01 Aug 2025: Short NKD 09-25 @ 40745 Signals.USAR.TR120
- 31 Jul 2025: Long NKD 09-25 @ 41130 Signals.USAR-MSFG
Overall Rating
- Short-Term: Bearish,
- Intermediate-Term: Neutral,
- Long-Term: Bullish.
Key Insights Summary
The NKD Nikkei/USD futures daily chart shows a market in transition. Short-term momentum is slow and the price is trading below both the weekly and monthly session fib grid centers, with the WSFG and MSFG trends both pointing down. The most recent swing pivot trend is down, with the next key resistance at 40795 and support at 40004. Short-term and intermediate-term moving averages (5, 10, 20-day) are all trending down, reinforcing the bearish short-term outlook. However, the 55, 100, and 200-day moving averages remain in uptrends, supporting a bullish long-term structure. The ATR and volume metrics indicate moderate volatility and activity. Recent trade signals show a short entry following a failed long, highlighting the choppy and corrective nature of the current price action. Overall, the market is experiencing a short-term pullback within a broader uptrend, with the potential for further consolidation or a test of lower support before any sustained recovery.
Chart Analysis ATS AI Generated: 2025-08-01 07:12 for Informational use only, not trading advice. Terms and Risk Disclosure Copyright © 2025. Algo Trading Systems LLC.
