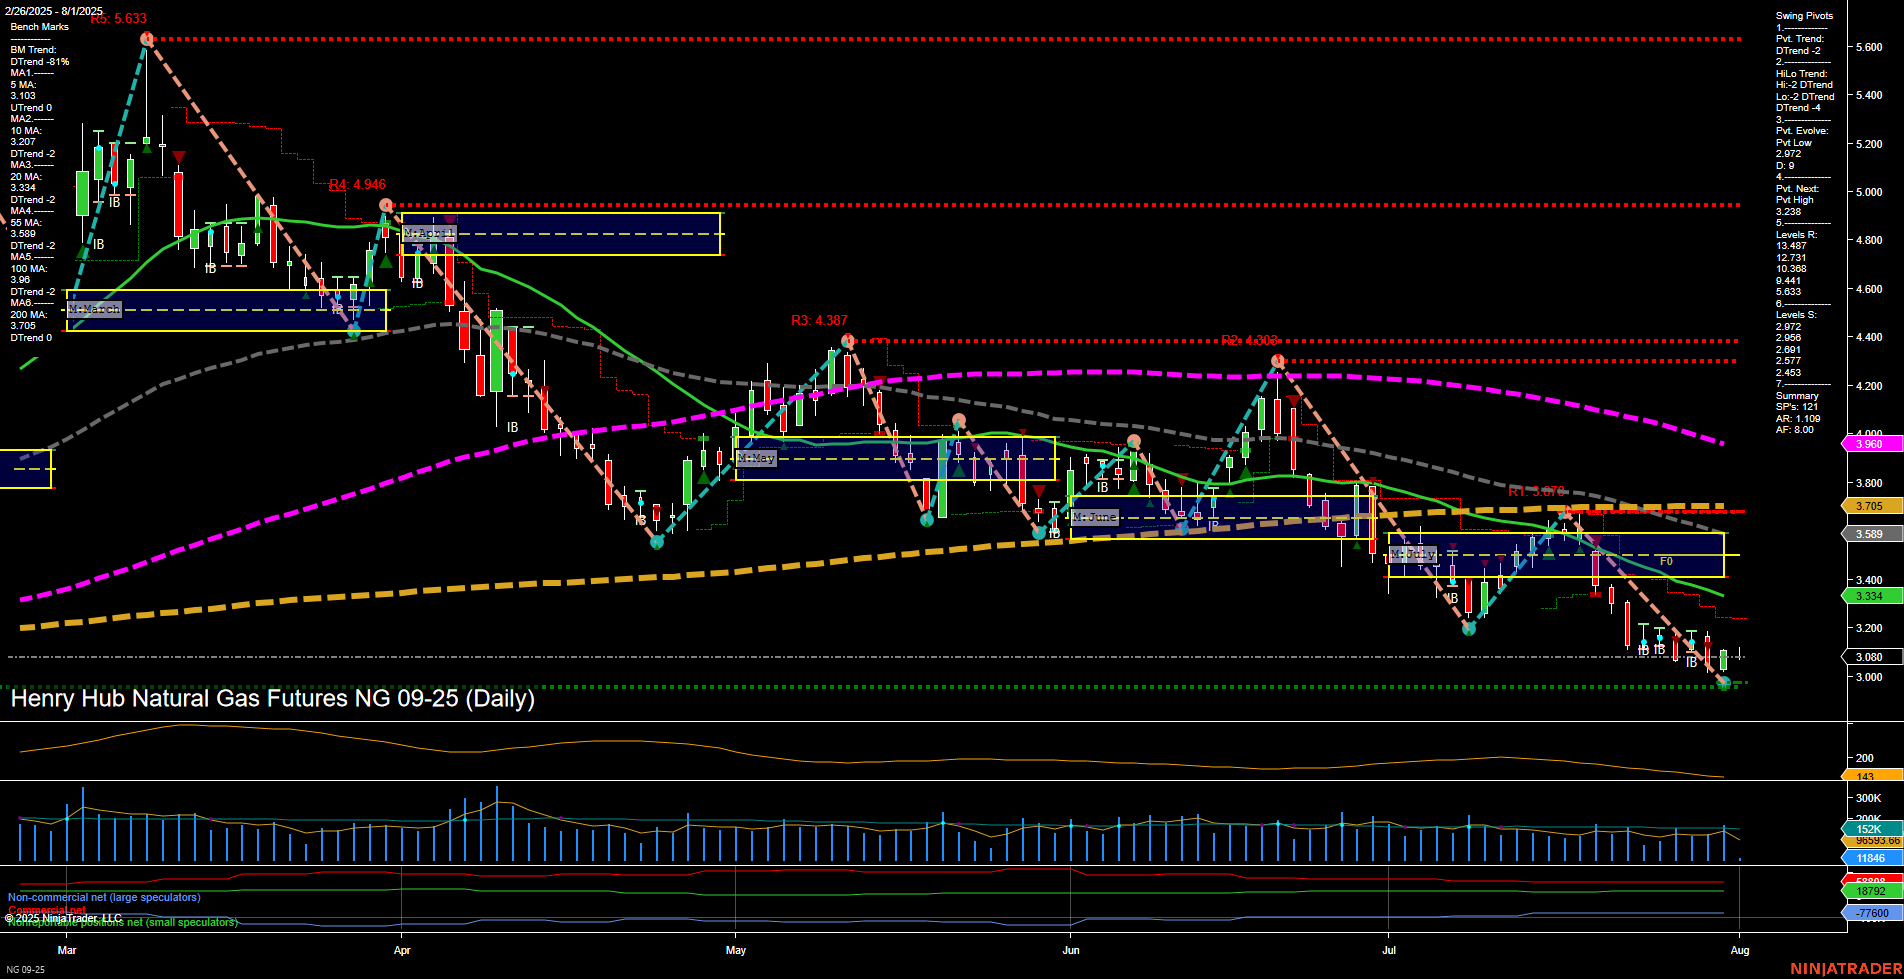
NG Henry Hub Natural Gas Futures Daily Chart Analysis: 2025-Aug-01 07:11 CT
Price Action
- Last: 3.089,
- Bars: Small,
- Mom: Momentum slow.
WSFG Weekly
- Short-Term
- WSFG Current: NA%
- F0%/NTZ' Bias: Price Neutral,
- WSFG Trend: Neutral.
MSFG Month Aug
- Intermediate-Term
- MSFG Current: NA%
- F0%/NTZ' Bias: Price Neutral,
- MSFG Trend: Neutral.
YSFG Year 2025
- Long-Term
- YSFG Current: NA%
- F0%/NTZ' Bias: Price Neutral,
- YSFG Trend: Neutral.
Swing Pivots
- (Short-Term) 1. Pvt. Trend: DTrend,
- (Intermediate-Term) 2. HiLo Trend: DTrend,
- 3. Pvt. Evolve: Pvt High 3.238,
- 4. Pvt. Next: Pvt Low 2.912,
- 5. Levels R: 4.946, 4.387, 4.304, 3.976, 3.633,
- 6. Levels S: 2.969, 2.617, 2.573, 2.453.
Daily Benchmarks
- (Short-Term) 5 Day: 3.103 Down Trend,
- (Short-Term) 10 Day: 3.207 Down Trend,
- (Intermediate-Term) 20 Day: 3.334 Down Trend,
- (Intermediate-Term) 55 Day: 3.589 Down Trend,
- (Long-Term) 100 Day: 3.960 Down Trend,
- (Long-Term) 200 Day: 3.705 Down Trend.
Additional Metrics
Recent Trade Signals
- 31 Jul 2025: Long NG 09-25 @ 3.1 Signals.USAR.TR120
Overall Rating
- Short-Term: Bearish,
- Intermediate-Term: Bearish,
- Long-Term: Bearish.
Key Insights Summary
Natural gas futures remain under pressure, with price action characterized by small bars and slow momentum, indicating a lack of strong directional conviction. All major swing pivot trends and moving averages are aligned to the downside, confirming a persistent bearish environment across short, intermediate, and long-term timeframes. The most recent swing pivot evolution is a lower high, and the next key level to watch is the potential formation of a new swing low at 2.912. Resistance levels are stacked well above current price, while support is clustered in the 2.45–2.97 range. Despite a recent long signal, the prevailing technical structure suggests the market is still in a corrective or consolidative phase after a prolonged downtrend, with no clear evidence of a reversal. Volatility (ATR) and volume metrics are moderate, reflecting a market that is consolidating rather than trending aggressively. Overall, the chart signals a continuation of the bearish bias unless a significant catalyst emerges to break the current pattern.
Chart Analysis ATS AI Generated: 2025-08-01 07:11 for Informational use only, not trading advice. Terms and Risk Disclosure Copyright © 2025. Algo Trading Systems LLC.
