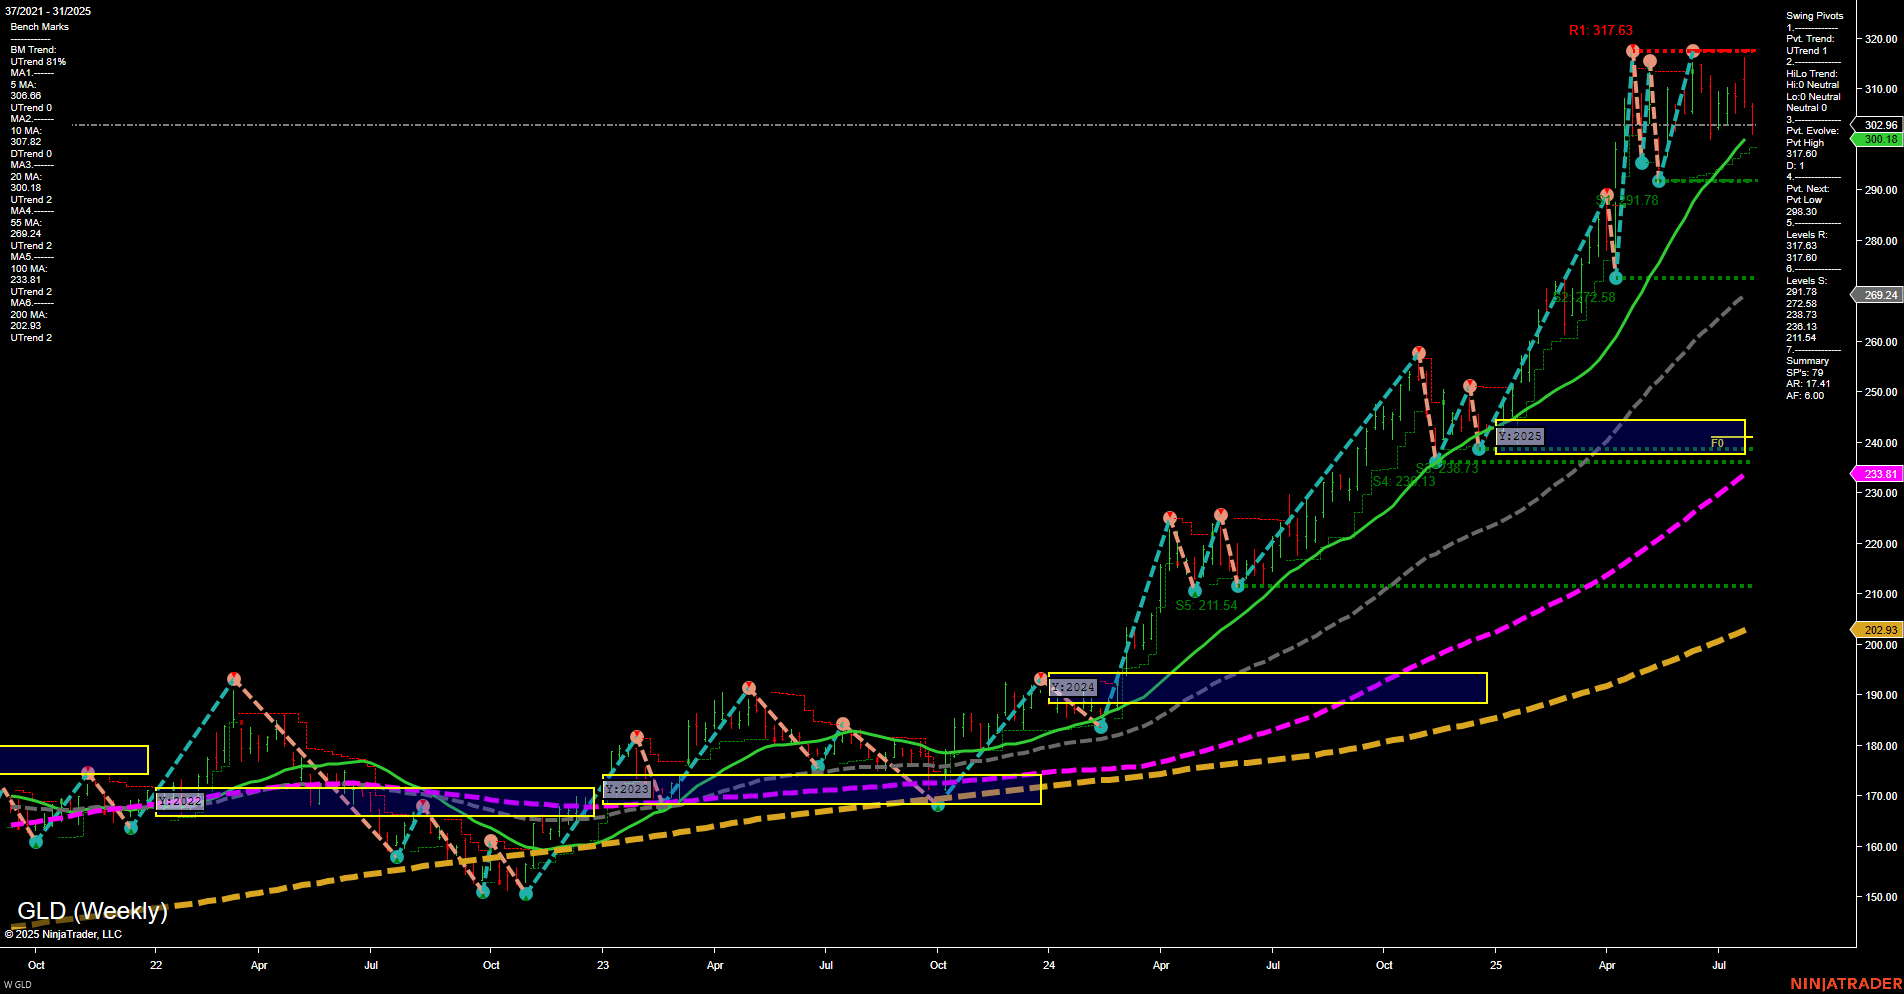
GLD SPDR Gold Shares Weekly Chart Analysis: 2025-Aug-01 07:11 CT
Price Action
- Last: 302.96,
- Bars: Medium,
- Mom: Momentum slow.
WSFG Weekly
- Short-Term
- WSFG Current: NA%
- F0%/NTZ' Bias: Price Neutral,
- WSFG Trend: Neutral.
MSFG Month Aug
- Intermediate-Term
- MSFG Current: NA%
- F0%/NTZ' Bias: Price Neutral,
- MSFG Trend: Neutral.
YSFG Year 2025
- Long-Term
- YSFG Current: NA%
- F0%/NTZ' Bias: Price Neutral,
- YSFG Trend: Neutral.
Swing Pivots
- (Short-Term) 1. Pvt. Trend: UTrend 1,
- (Intermediate-Term) 2. HiLo Trend: UTrend 2,
- 3. Pvt. Evolve: Pvt high 317.63,
- 4. Pvt. Next: Pvt low 269.36,
- 5. Levels R: 317.63,
- 6. Levels S: 269.36, 228.78, 222.15, 211.54.
Weekly Benchmarks
- (Intermediate-Term) 5 Week: 306.68 Up Trend,
- (Intermediate-Term) 10 Week: 307.82 Down Trend,
- (Long-Term) 20 Week: 291.78 Up Trend,
- (Long-Term) 55 Week: 260.14 Up Trend,
- (Long-Term) 100 Week: 233.81 Up Trend,
- (Long-Term) 200 Week: 202.93 Up Trend.
Overall Rating
- Short-Term: Neutral,
- Intermediate-Term: Bullish,
- Long-Term: Bullish.
Key Insights Summary
GLD has experienced a strong multi-month rally, with price consolidating near all-time highs around 317.63. The short-term trend has flattened, as indicated by neutral WSFG and a slow momentum reading, suggesting a pause or digestion phase after the recent advance. The intermediate and long-term trends remain bullish, supported by higher swing lows and a series of rising long-term moving averages. Key support levels are well below current price, with the nearest at 269.36, providing a wide buffer for any corrective moves. Resistance is defined by the recent swing high at 317.63. The chart structure shows a classic consolidation at highs, often a precursor to either a breakout continuation or a deeper retracement. No clear directional bias is present in the short term, but the underlying structure remains constructive for bulls on any sustained breakout above resistance or on successful retests of support.
Chart Analysis ATS AI Generated: 2025-08-01 07:11 for Informational use only, not trading advice. Terms and Risk Disclosure Copyright © 2025. Algo Trading Systems LLC.
