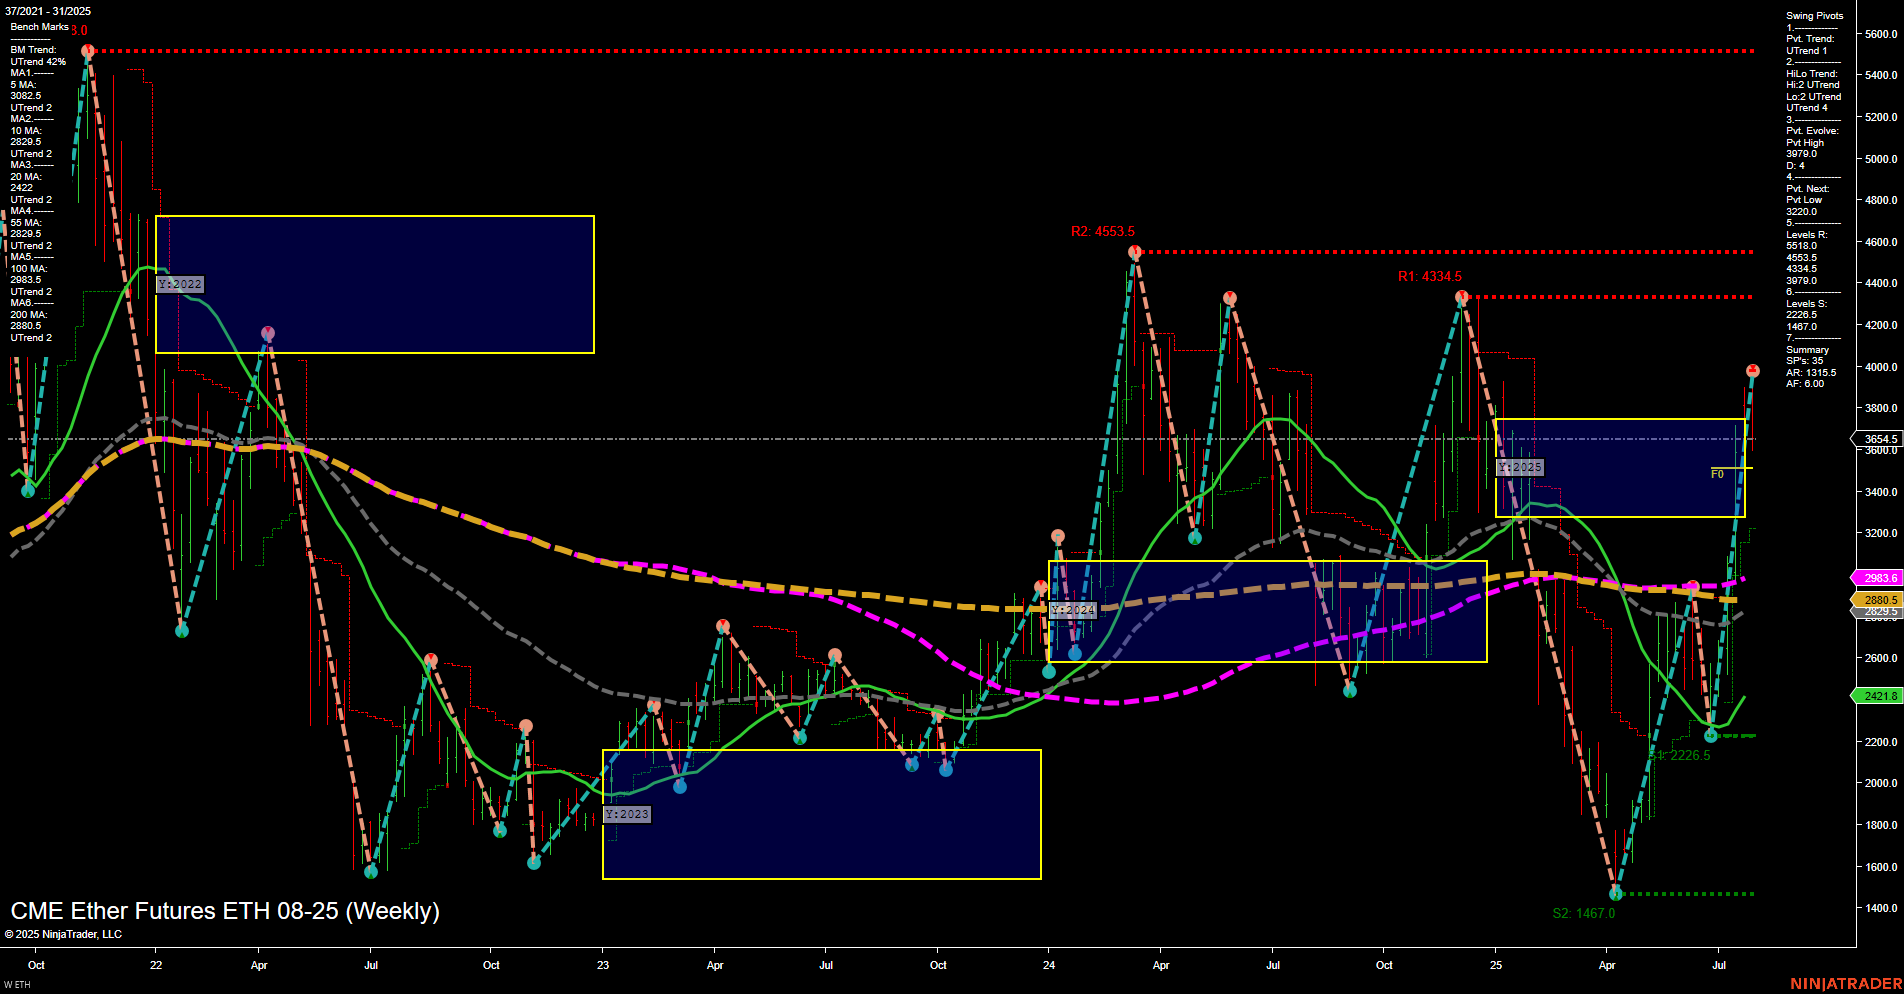
The current weekly chart for ETH CME Ether Futures shows a strong recent rally with large, fast momentum bars pushing price up to the 3713 level, just below a key swing resistance at 3710.0. Despite this upward surge, both the Weekly and Monthly Session Fib Grids (WSFG, MSFG) indicate price is below their respective NTZ/F0% levels, with both trends pointing down, suggesting short-term and intermediate-term weakness or potential exhaustion after the rally. However, the Yearly Session Fib Grid (YSFG) remains positive, with price above the yearly NTZ/F0% and the long-term trend up, supported by all major moving averages trending higher. Swing pivots confirm an uptrend in both short- and intermediate-term metrics, but the most recent trade signals have triggered short entries, indicating a possible short-term reversal or pullback from resistance. Key resistance levels are stacked above, while support is well below, highlighting a wide trading range. Overall, the market is in a transition phase: short-term signals are bearish after a strong run-up, intermediate-term is neutral as the market digests gains, and the long-term structure remains bullish with higher lows and rising averages. Volatility is elevated, and the market may be setting up for a period of consolidation or a corrective pullback before the next directional move.