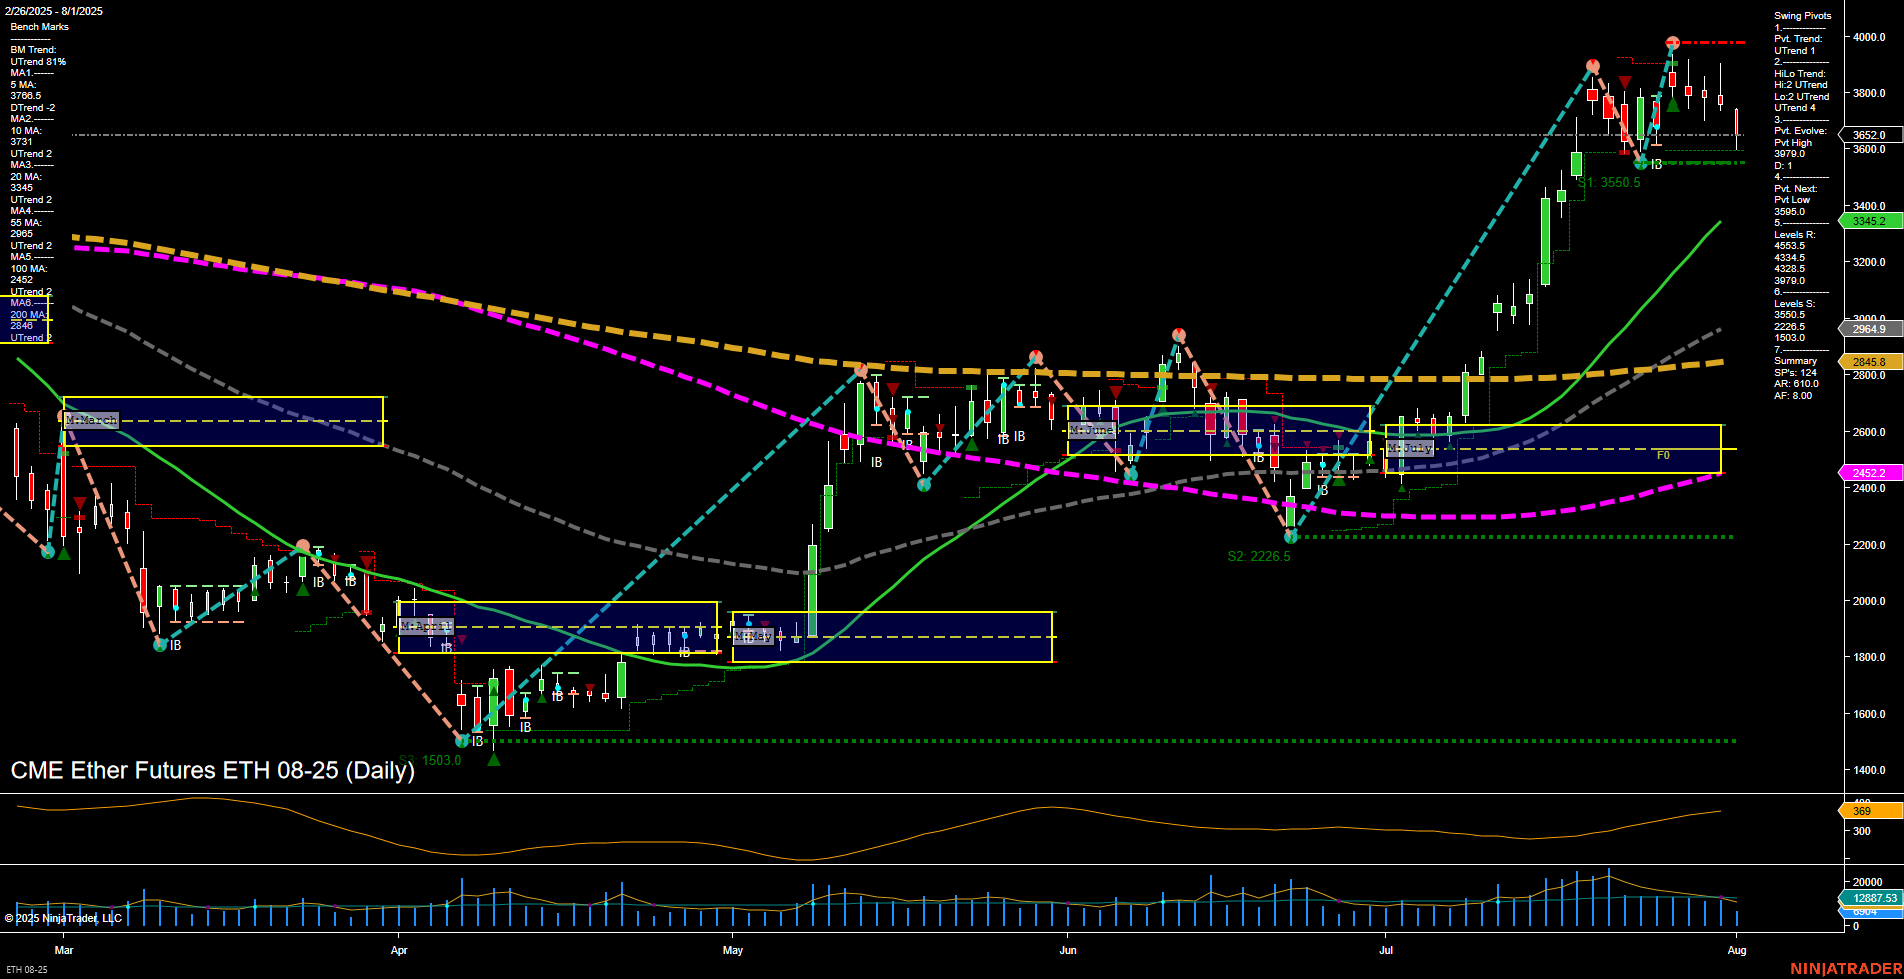
ETH CME Ether Futures Daily Chart Analysis: 2025-Aug-01 07:08 CT
Price Action
- Last: 3713,
- Bars: Medium,
- Mom: Average.
WSFG Weekly
- Short-Term
- WSFG Current: -47%
- F0%/NTZ' Bias: Price Below,
- WSFG Trend: Down.
MSFG Month Aug
- Intermediate-Term
- MSFG Current: -6%
- F0%/NTZ' Bias: Price Below,
- MSFG Trend: Down.
YSFG Year 2025
- Long-Term
- YSFG Current: 6%
- F0%/NTZ' Bias: Price Above,
- YSFG Trend: Up.
Swing Pivots
- (Short-Term) 1. Pvt. Trend: DTrend,
- (Intermediate-Term) 2. HiLo Trend: UTrend,
- 3. Pvt. Evolve: Pvt High 3970,
- 4. Pvt. Next: Pvt Low 3550,
- 5. Levels R: 3955, 4505.5, 4343.5, 4234.5, 4138.5,
- 6. Levels S: 3550, 2226.5, 1503.
Daily Benchmarks
- (Short-Term) 5 Day: 3706.5 Down Trend,
- (Short-Term) 10 Day: 3737 Down Trend,
- (Intermediate-Term) 20 Day: 3445.2 Up Trend,
- (Intermediate-Term) 55 Day: 2845.8 Up Trend,
- (Long-Term) 100 Day: 2452.2 Up Trend,
- (Long-Term) 200 Day: 2452.2 Up Trend.
Additional Metrics
Recent Trade Signals
- 01 Aug 2025: Short ETH 08-25 @ 3713 Signals.USAR.TR120
- 31 Jul 2025: Short ETH 08-25 @ 3795.5 Signals.USAR-WSFG
Overall Rating
- Short-Term: Bearish,
- Intermediate-Term: Bullish,
- Long-Term: Bullish.
Key Insights Summary
The current ETH CME Ether Futures daily chart shows a notable divergence between short-term and longer-term trends. Price action has recently shifted to the downside, with medium-sized bars and average momentum, as confirmed by the latest short signals and the downward direction of both the 5-day and 10-day moving averages. The WSFG and MSFG both indicate price is below their respective NTZ/F0% levels, reinforcing a short-term and intermediate-term bearish bias. However, the intermediate and long-term moving averages (20, 55, 100, and 200 day) remain in uptrends, and the yearly session fib grid trend is still up, suggesting the broader trend is intact.
Swing pivots highlight a recent pivot high at 3970, with the next key support at 3550. Resistance levels are stacked above, with 3955 as the nearest. The ATR and VOLMA values indicate moderate volatility and healthy volume. The market appears to be in a corrective phase within a larger uptrend, with the potential for further pullback or consolidation before any resumption of the primary bullish trend. This environment is typical of a market digesting recent gains, with short-term traders reacting to overbought conditions while longer-term participants remain constructive.
Chart Analysis ATS AI Generated: 2025-08-01 07:08 for Informational use only, not trading advice. Terms and Risk Disclosure Copyright © 2025. Algo Trading Systems LLC.
