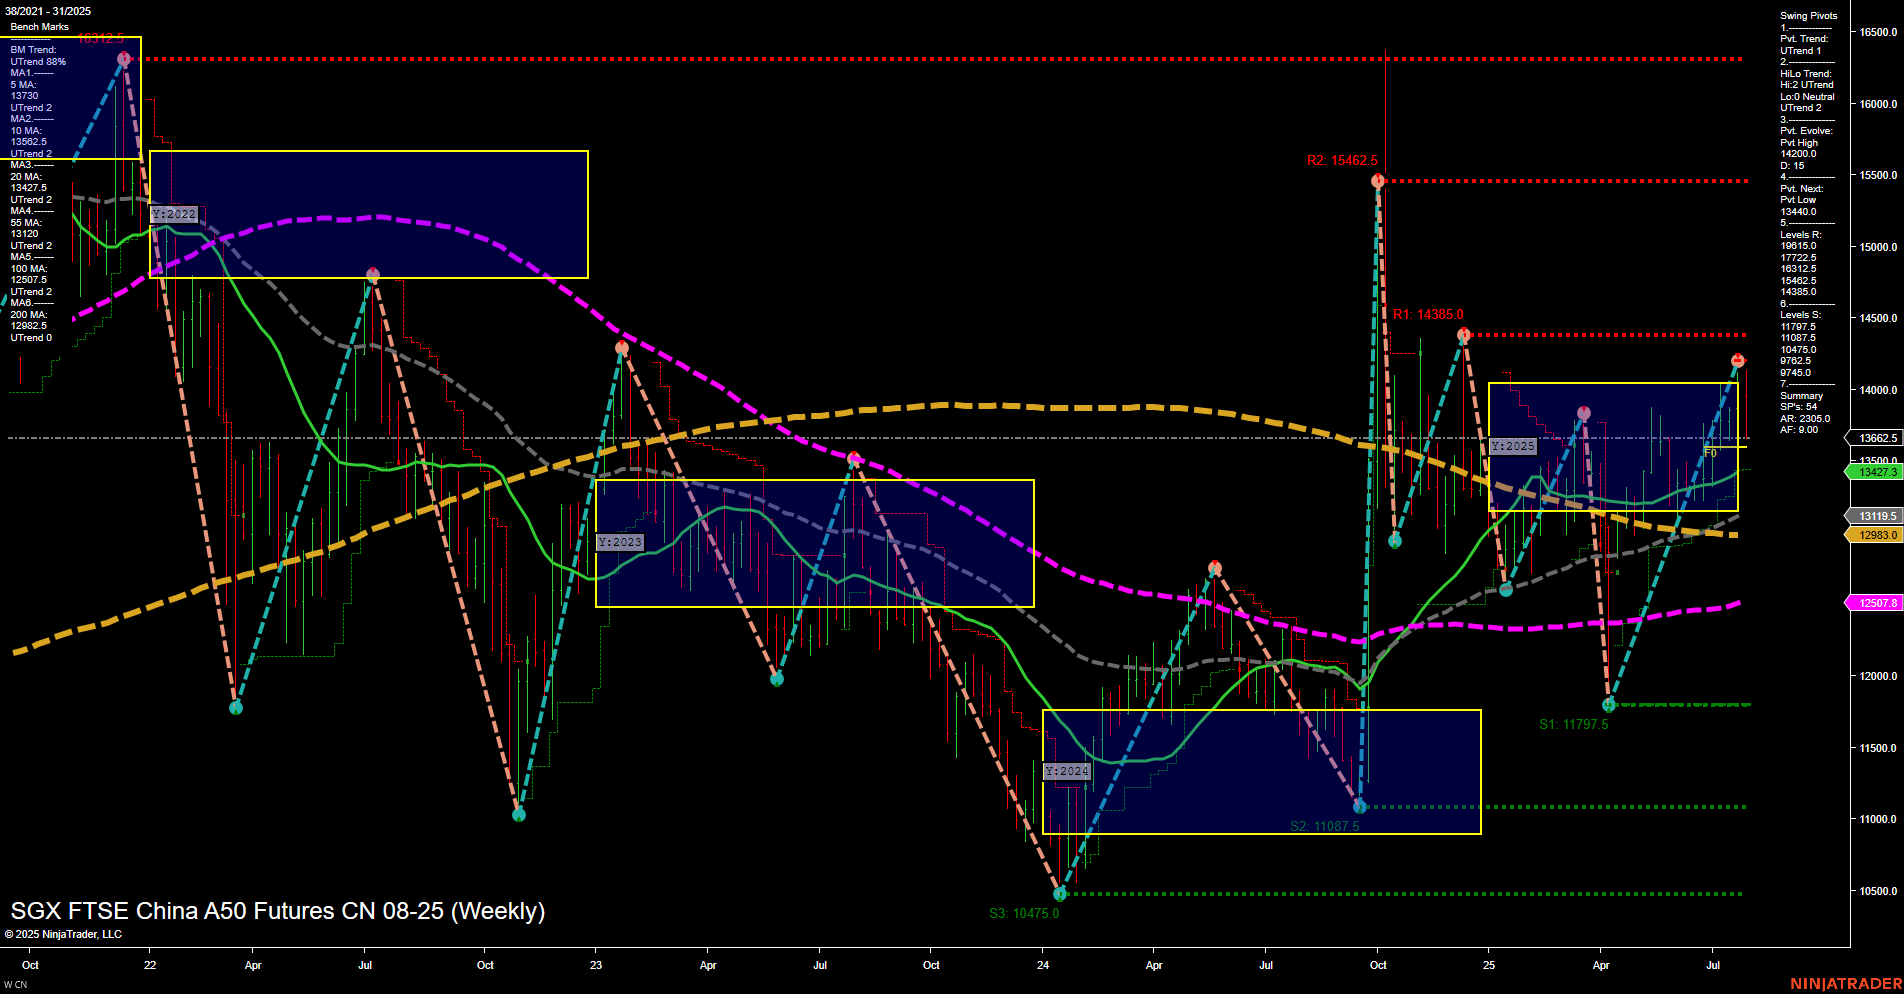
CN SGX FTSE China A50 Futures Weekly Chart Analysis: 2025-Aug-01 07:06 CT
Price Action
- Last: 13,662.5,
- Bars: Medium,
- Mom: Momentum average.
WSFG Weekly
- Short-Term
- WSFG Current: NA%
- F0%/NTZ' Bias: Price Neutral,
- WSFG Trend: Neutral.
MSFG Month Aug
- Intermediate-Term
- MSFG Current: NA%
- F0%/NTZ' Bias: Price Neutral,
- MSFG Trend: Neutral.
YSFG Year 2025
- Long-Term
- YSFG Current: NA%
- F0%/NTZ' Bias: Price Neutral,
- YSFG Trend: Neutral.
Swing Pivots
- (Short-Term) 1. Pvt. Trend: UTrend,
- (Intermediate-Term) 2. HiLo Trend: UTrend,
- 3. Pvt. Evolve: Pvt high 14,200,
- 4. Pvt. Next: Pvt low 13,440,
- 5. Levels R: 15,462.5, 14,385.0, 13,722.5,
- 6. Levels S: 11,975.0, 11,087.5, 10,475.0.
Weekly Benchmarks
- (Intermediate-Term) 5 Week: 13,473.7 Up Trend,
- (Intermediate-Term) 10 Week: 13,119.5 Up Trend,
- (Long-Term) 20 Week: 12,893.0 Up Trend,
- (Long-Term) 55 Week: 12,507.8 Down Trend,
- (Long-Term) 100 Week: 12,507.8 Down Trend,
- (Long-Term) 200 Week: NA.
Overall Rating
- Short-Term: Bullish,
- Intermediate-Term: Bullish,
- Long-Term: Neutral.
Key Insights Summary
The CN SGX FTSE China A50 Futures weekly chart shows a market in recovery mode, with price action stabilizing above key moving averages and a series of higher swing lows and highs. Both short-term and intermediate-term trends are upward, supported by the 5, 10, and 20-week moving averages all trending higher. The most recent swing pivot is a high at 14,200, with the next key support at 13,440, indicating a potential consolidation zone. Resistance levels are well-defined at 13,722.5, 14,385.0, and 15,462.5, while support is established at 11,975.0, 11,087.5, and 10,475.0. The long-term trend remains neutral as the 55 and 100-week moving averages are still in a downtrend, suggesting the market is in a transitional phase. The overall structure points to a bullish bias in the short and intermediate term, with the potential for further upside if resistance levels are breached, but with caution warranted as the long-term trend has yet to fully confirm a reversal. The chart reflects a market that has moved out of a prolonged downtrend, is currently consolidating, and may be setting up for a larger directional move as volatility compresses and price tests key levels.
Chart Analysis ATS AI Generated: 2025-08-01 07:06 for Informational use only, not trading advice. Terms and Risk Disclosure Copyright © 2025. Algo Trading Systems LLC.
