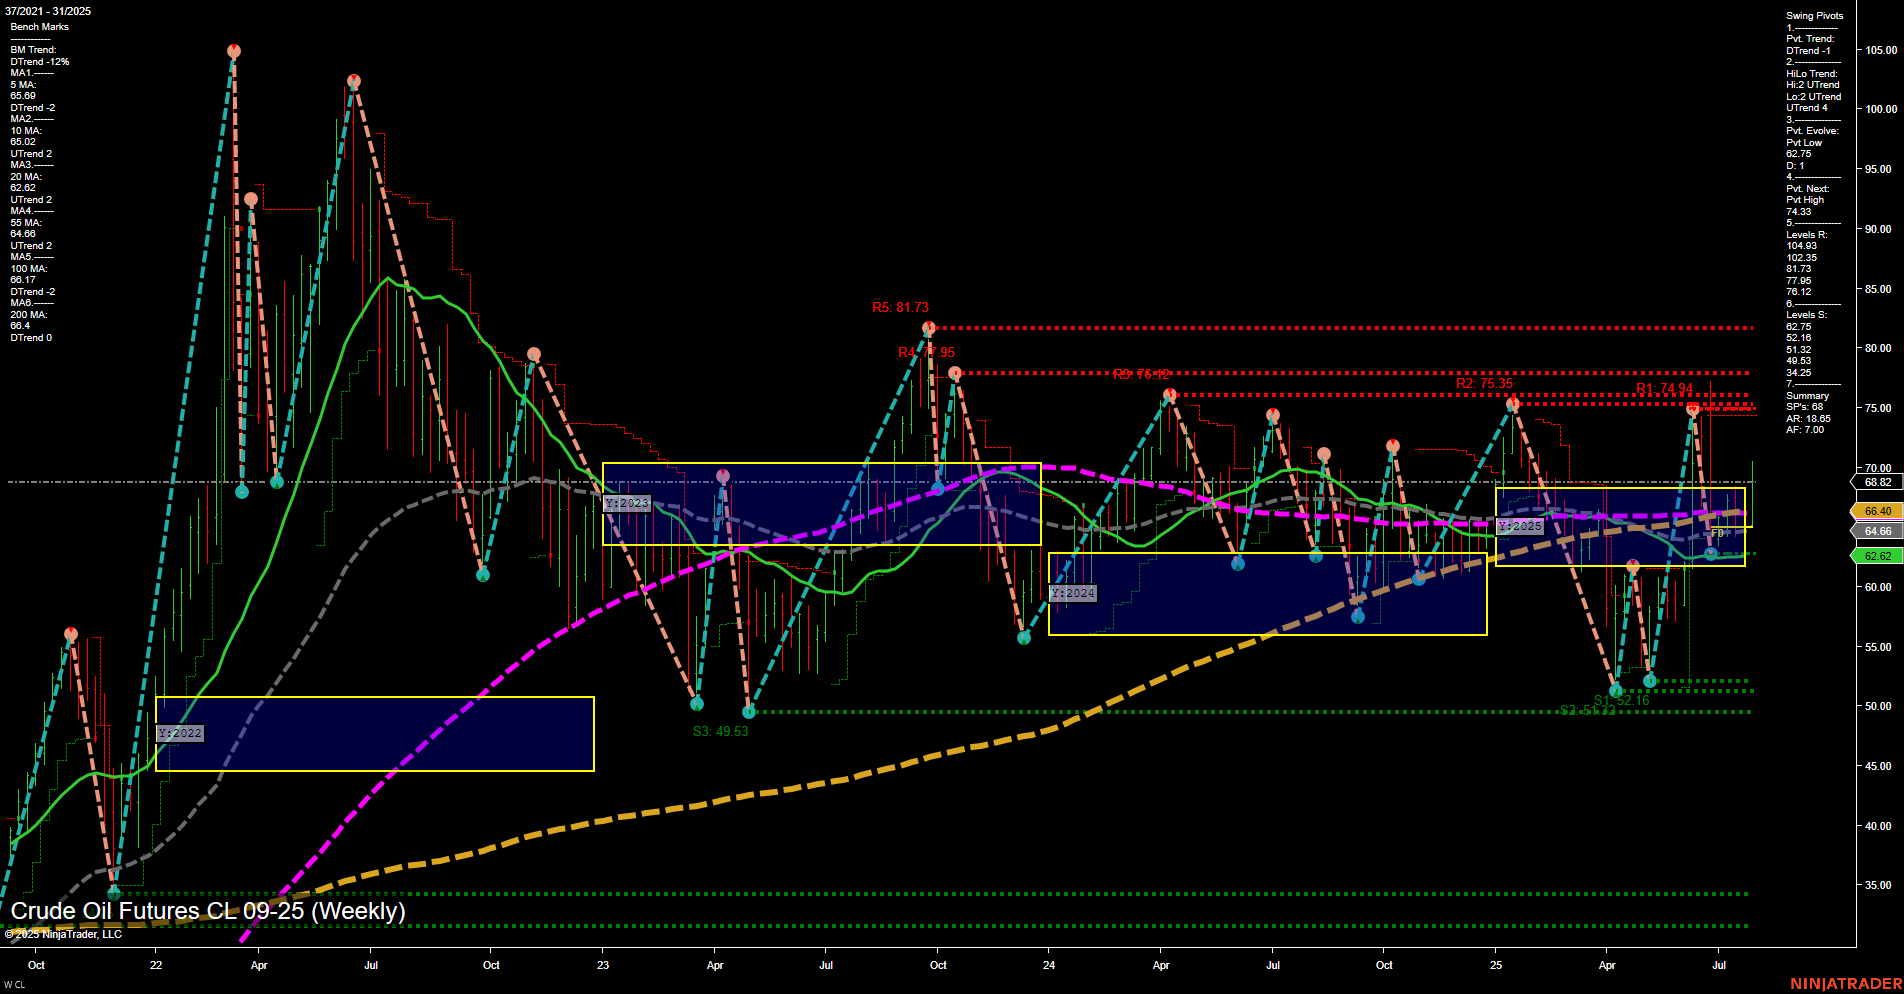
CL Crude Oil Futures Weekly Chart Analysis: 2025-Aug-01 07:05 CT
Price Action
- Last: 68.82,
- Bars: Medium,
- Mom: Momentum average.
WSFG Weekly
- Short-Term
- WSFG Current: 118%
- F0%/NTZ' Bias: Price Above,
- WSFG Trend: Up.
MSFG Month Aug
- Intermediate-Term
- MSFG Current: -5%
- F0%/NTZ' Bias: Price Below,
- MSFG Trend: Down.
YSFG Year 2025
- Long-Term
- YSFG Current: 11%
- F0%/NTZ' Bias: Price Above,
- YSFG Trend: Up.
Swing Pivots
- (Short-Term) 1. Pvt. Trend: DTrend,
- (Intermediate-Term) 2. HiLo Trend: UTrend,
- 3. Pvt. Evolve: Pvt low 62.16,
- 4. Pvt. Next: Pvt high 74.94,
- 5. Levels R: 81.73, 76.42, 75.35, 74.94,
- 6. Levels S: 62.16, 51.33, 49.53.
Weekly Benchmarks
- (Intermediate-Term) 5 Week: 64.66 Down Trend,
- (Intermediate-Term) 10 Week: 62.62 Down Trend,
- (Long-Term) 20 Week: 66.40 Up Trend,
- (Long-Term) 55 Week: 64.66 Down Trend,
- (Long-Term) 100 Week: 68.77 Down Trend,
- (Long-Term) 200 Week: 66.04 Up Trend.
Recent Trade Signals
- 01 Aug 2025: Short CL 09-25 @ 68.74 Signals.USAR.TR120
- 30 Jul 2025: Long CL 09-25 @ 69.25 Signals.USAR.TR720
- 25 Jul 2025: Short CL 09-25 @ 65.57 Signals.USAR-WSFG
- 25 Jul 2025: Long CL 09-25 @ 66.29 Signals.USAR-MSFG
Overall Rating
- Short-Term: Neutral,
- Intermediate-Term: Neutral,
- Long-Term: Bullish.
Key Insights Summary
The current weekly chart for CL Crude Oil Futures shows a market in transition, with mixed signals across timeframes. Price action is consolidating near 68.82, with medium-sized bars and average momentum, reflecting a market that is neither strongly trending nor reversing sharply. The short-term WSFG trend is up, with price above the NTZ, but the swing pivot trend is down, indicating recent selling pressure. Intermediate-term signals are mixed: the MSFG trend is down and price is below the monthly NTZ, but the HiLo trend remains up, suggesting underlying support from prior higher lows. Long-term, the yearly session grid and several moving averages (20 and 200 week) are trending up, supporting a bullish outlook, though the 55 and 100 week MAs are still in downtrends, highlighting ongoing volatility and a lack of clear direction. Resistance is clustered in the mid-70s to low-80s, while support is strong at 62.16 and lower at 51.33. Recent trade signals show both long and short entries, underscoring the choppy, range-bound nature of the current market. Overall, the chart suggests a market in consolidation, with potential for breakout moves as price tests key resistance and support levels, but with no dominant trend in the short or intermediate term.
Chart Analysis ATS AI Generated: 2025-08-01 07:05 for Informational use only, not trading advice. Terms and Risk Disclosure Copyright © 2025. Algo Trading Systems LLC.
