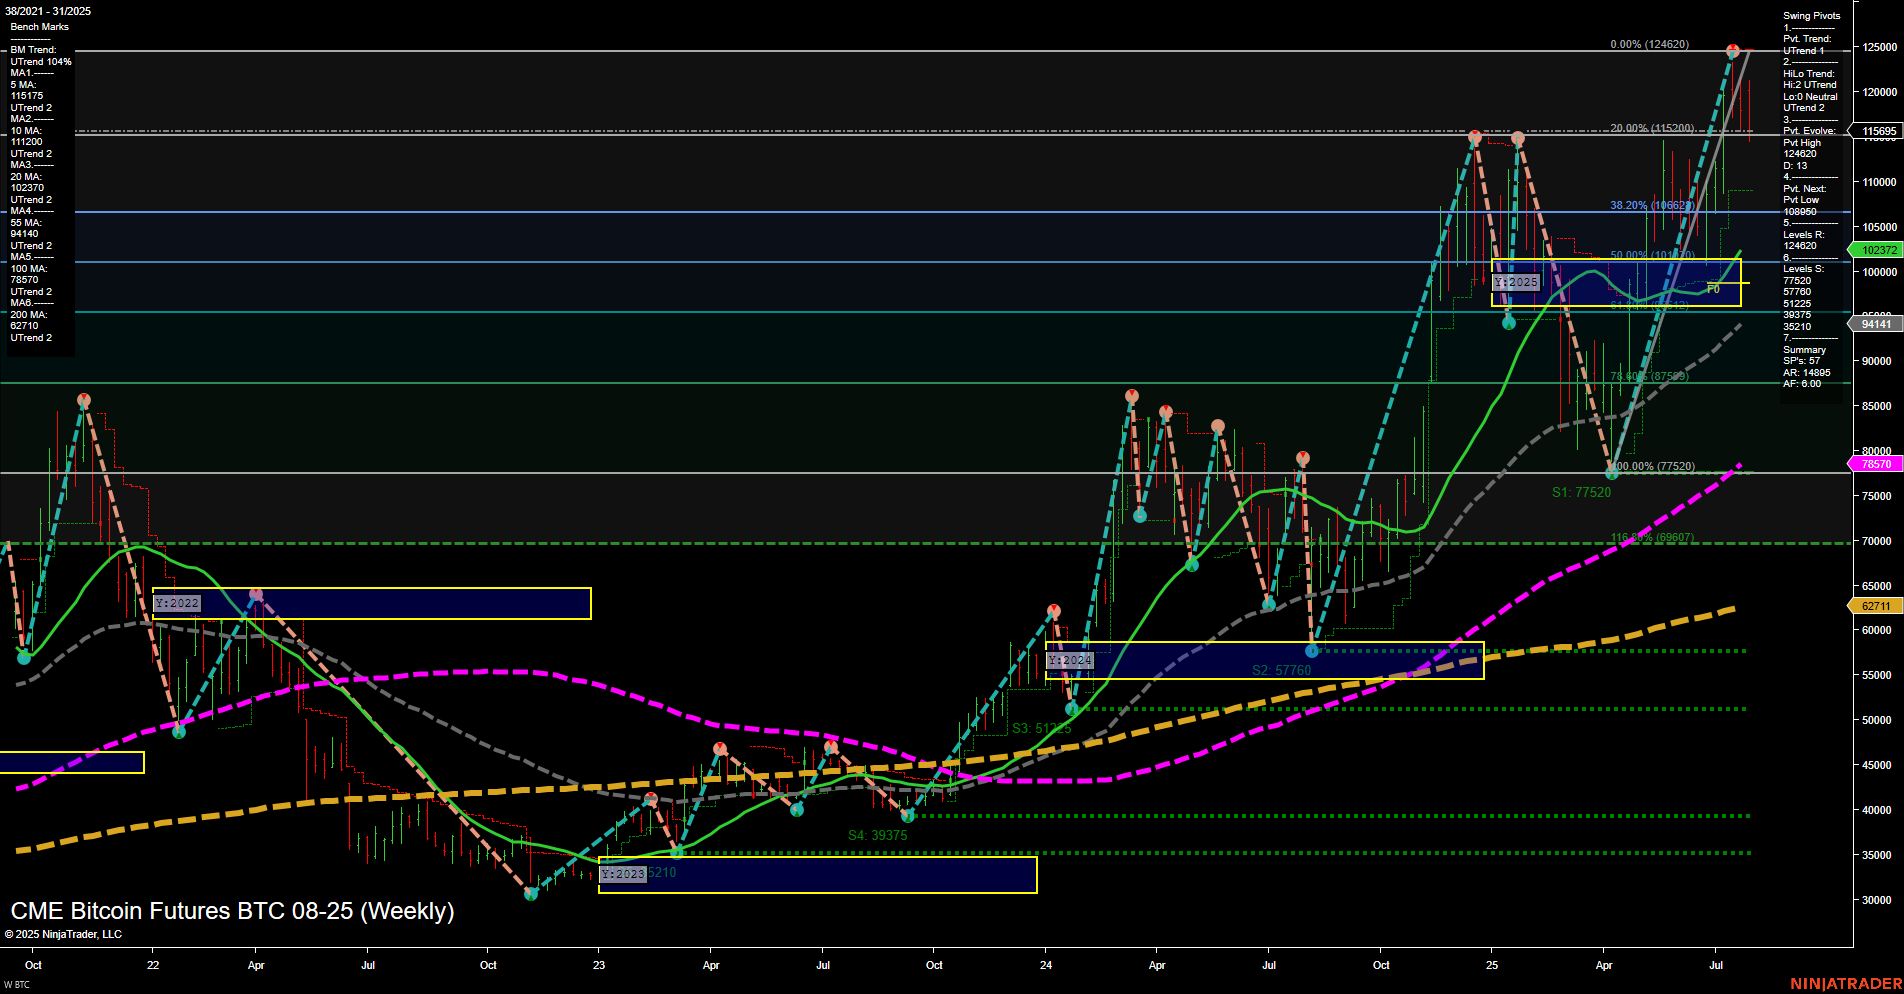
BTC CME Bitcoin Futures Weekly Chart Analysis: 2025-Aug-01 07:04 CT
Price Action
- Last: 117450,
- Bars: Large,
- Mom: Momentum fast.
WSFG Weekly
- Short-Term
- WSFG Current: -59%
- F0%/NTZ' Bias: Price Below,
- WSFG Trend: Down.
MSFG Month Aug
- Intermediate-Term
- MSFG Current: -1%
- F0%/NTZ' Bias: Price Below,
- MSFG Trend: Down.
YSFG Year 2025
- Long-Term
- YSFG Current: 64%
- F0%/NTZ' Bias: Price Above,
- YSFG Trend: Up.
Swing Pivots
- (Short-Term) 1. Pvt. Trend: DTrend,
- (Intermediate-Term) 2. HiLo Trend: UTrend,
- 3. Pvt. Evolve: Pvt high 124630,
- 4. Pvt. Next: Pvt low 109650,
- 5. Levels R: 124620, 115095, 106625,
- 6. Levels S: 99372, 87750, 77520, 57760, 5210, 39375.
Weekly Benchmarks
- (Intermediate-Term) 5 Week: 115175 Up Trend,
- (Intermediate-Term) 10 Week: 111200 Up Trend,
- (Long-Term) 20 Week: 103730 Up Trend,
- (Long-Term) 55 Week: 78570 Up Trend,
- (Long-Term) 100 Week: 62711 Up Trend,
- (Long-Term) 200 Week: 52100 Up Trend.
Recent Trade Signals
- 31 Jul 2025: Short BTC 08-25 @ 117450 Signals.USAR.TR120
- 25 Jul 2025: Short BTC 08-25 @ 118440 Signals.USAR-WSFG
Overall Rating
- Short-Term: Bearish,
- Intermediate-Term: Neutral,
- Long-Term: Bullish.
Key Insights Summary
The BTC CME Bitcoin Futures weekly chart shows a market in transition. Price action is volatile with large bars and fast momentum, indicating heightened activity and possible exhaustion after a strong rally. Short-term and intermediate-term Fib grid trends have turned down, with price now below their respective NTZ/F0% levels, suggesting a pullback or correction phase is underway. The most recent swing pivot is a high at 124630, with the next key pivot low at 109650, highlighting a potential retracement zone. Resistance is stacked above at 124620, 115095, and 106625, while support is layered below at 99372, 87750, and 77520, providing clear levels to watch for reaction. All benchmark moving averages from 5 to 200 weeks remain in uptrends, underscoring the strength of the long-term bullish structure despite the current short-term weakness. Recent trade signals have shifted to short, aligning with the short-term bearish outlook. Overall, the market is experiencing a corrective phase within a broader uptrend, with the potential for further downside in the near term before the long-term bullish trend may reassert itself.
Chart Analysis ATS AI Generated: 2025-08-01 07:05 for Informational use only, not trading advice. Terms and Risk Disclosure Copyright © 2025. Algo Trading Systems LLC.
