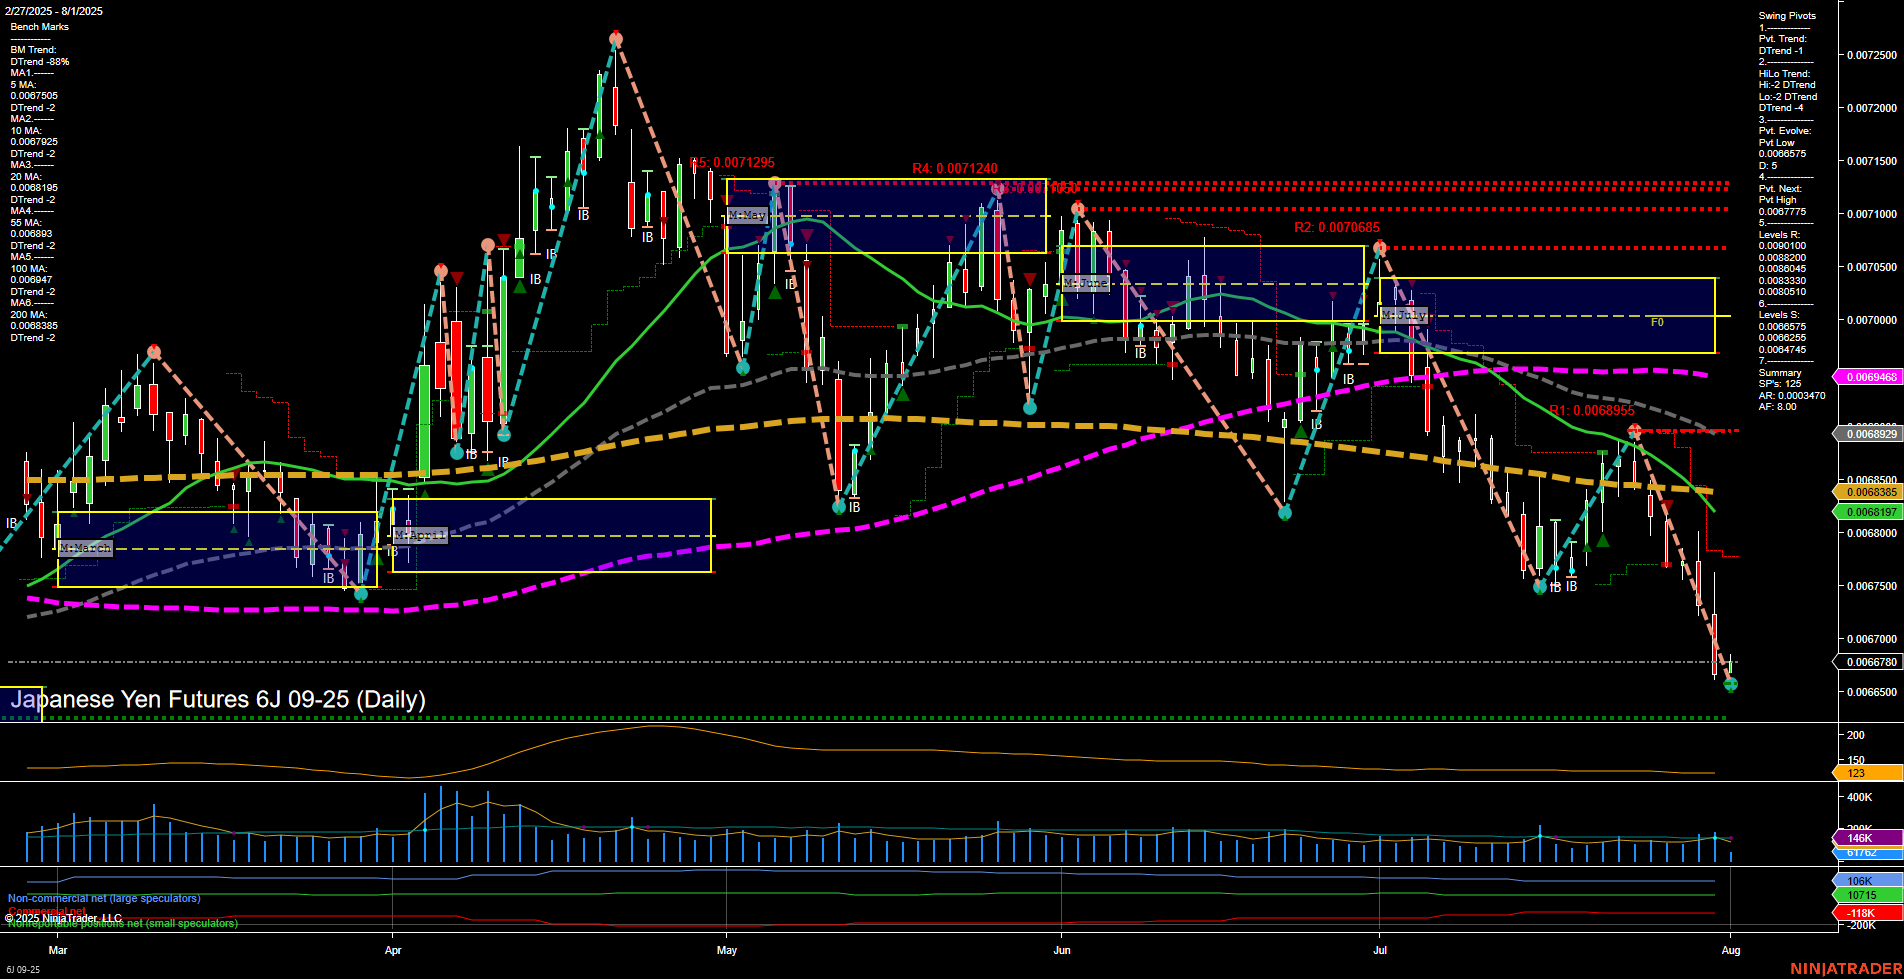
6J Japanese Yen Futures Daily Chart Analysis: 2025-Aug-01 07:03 CT
Price Action
- Last: 0.006735,
- Bars: Large,
- Mom: Momentum fast.
WSFG Weekly
- Short-Term
- WSFG Current: -111%
- F0%/NTZ' Bias: Price Below,
- WSFG Trend: Down.
MSFG Month Aug
- Intermediate-Term
- MSFG Current: 1%
- F0%/NTZ' Bias: Price Above,
- MSFG Trend: Up.
YSFG Year 2025
- Long-Term
- YSFG Current: 12%
- F0%/NTZ' Bias: Price Above,
- YSFG Trend: Up.
Swing Pivots
- (Short-Term) 1. Pvt. Trend: DTrend,
- (Intermediate-Term) 2. HiLo Trend: DTrend,
- 3. Pvt. Evolve: Pvt low 0.006735,
- 4. Pvt. Next: Pvt high 0.0067775,
- 5. Levels R: 0.0072500, 0.0072000, 0.0071500, 0.0071240, 0.0070685, 0.0068955, 0.0068500, 0.0068310, 0.0068105, 0.0068000, 0.0067925, 0.0067775,
- 6. Levels S: 0.006735, 0.0066835.
Daily Benchmarks
- (Short-Term) 5 Day: 0.0067505 Down Trend,
- (Short-Term) 10 Day: 0.0067895 Down Trend,
- (Intermediate-Term) 20 Day: 0.0068197 Down Trend,
- (Intermediate-Term) 55 Day: 0.0068929 Down Trend,
- (Long-Term) 100 Day: 0.0069468 Down Trend,
- (Long-Term) 200 Day: 0.0069835 Down Trend.
Additional Metrics
Recent Trade Signals
- 30 Jul 2025: Short 6J 09-25 @ 0.006743 Signals.USAR.TR720
- 28 Jul 2025: Short 6J 09-25 @ 0.006793 Signals.USAR-WSFG
- 25 Jul 2025: Short 6J 09-25 @ 0.006824 Signals.USAR.TR120
Overall Rating
- Short-Term: Bearish,
- Intermediate-Term: Bearish,
- Long-Term: Bullish.
Key Insights Summary
The 6J Japanese Yen futures are experiencing strong downward momentum in the short and intermediate term, as evidenced by large, fast-moving bars and a clear downtrend across all short and intermediate moving averages. The price is trading below the weekly session fib grid (WSFG) NTZ, reinforcing the bearish short-term bias, while the swing pivot structure confirms a dominant downtrend with new lows being set and resistance levels stacking above. However, the long-term outlook remains bullish, with the yearly session fib grid (YSFG) and monthly session fib grid (MSFG) both showing price above their respective NTZs and uptrends in place. Recent trade signals have all been to the short side, aligning with the prevailing short-term and intermediate-term weakness. Volatility is elevated (ATR 118), and volume remains robust, suggesting active participation during this selloff. The market is currently testing key support at 0.006735, with the next support at 0.0066835, while resistance levels are layered above, indicating potential for further volatility and possible short-term rebounds within a broader long-term uptrend context.
Chart Analysis ATS AI Generated: 2025-08-01 07:04 for Informational use only, not trading advice. Terms and Risk Disclosure Copyright © 2025. Algo Trading Systems LLC.
