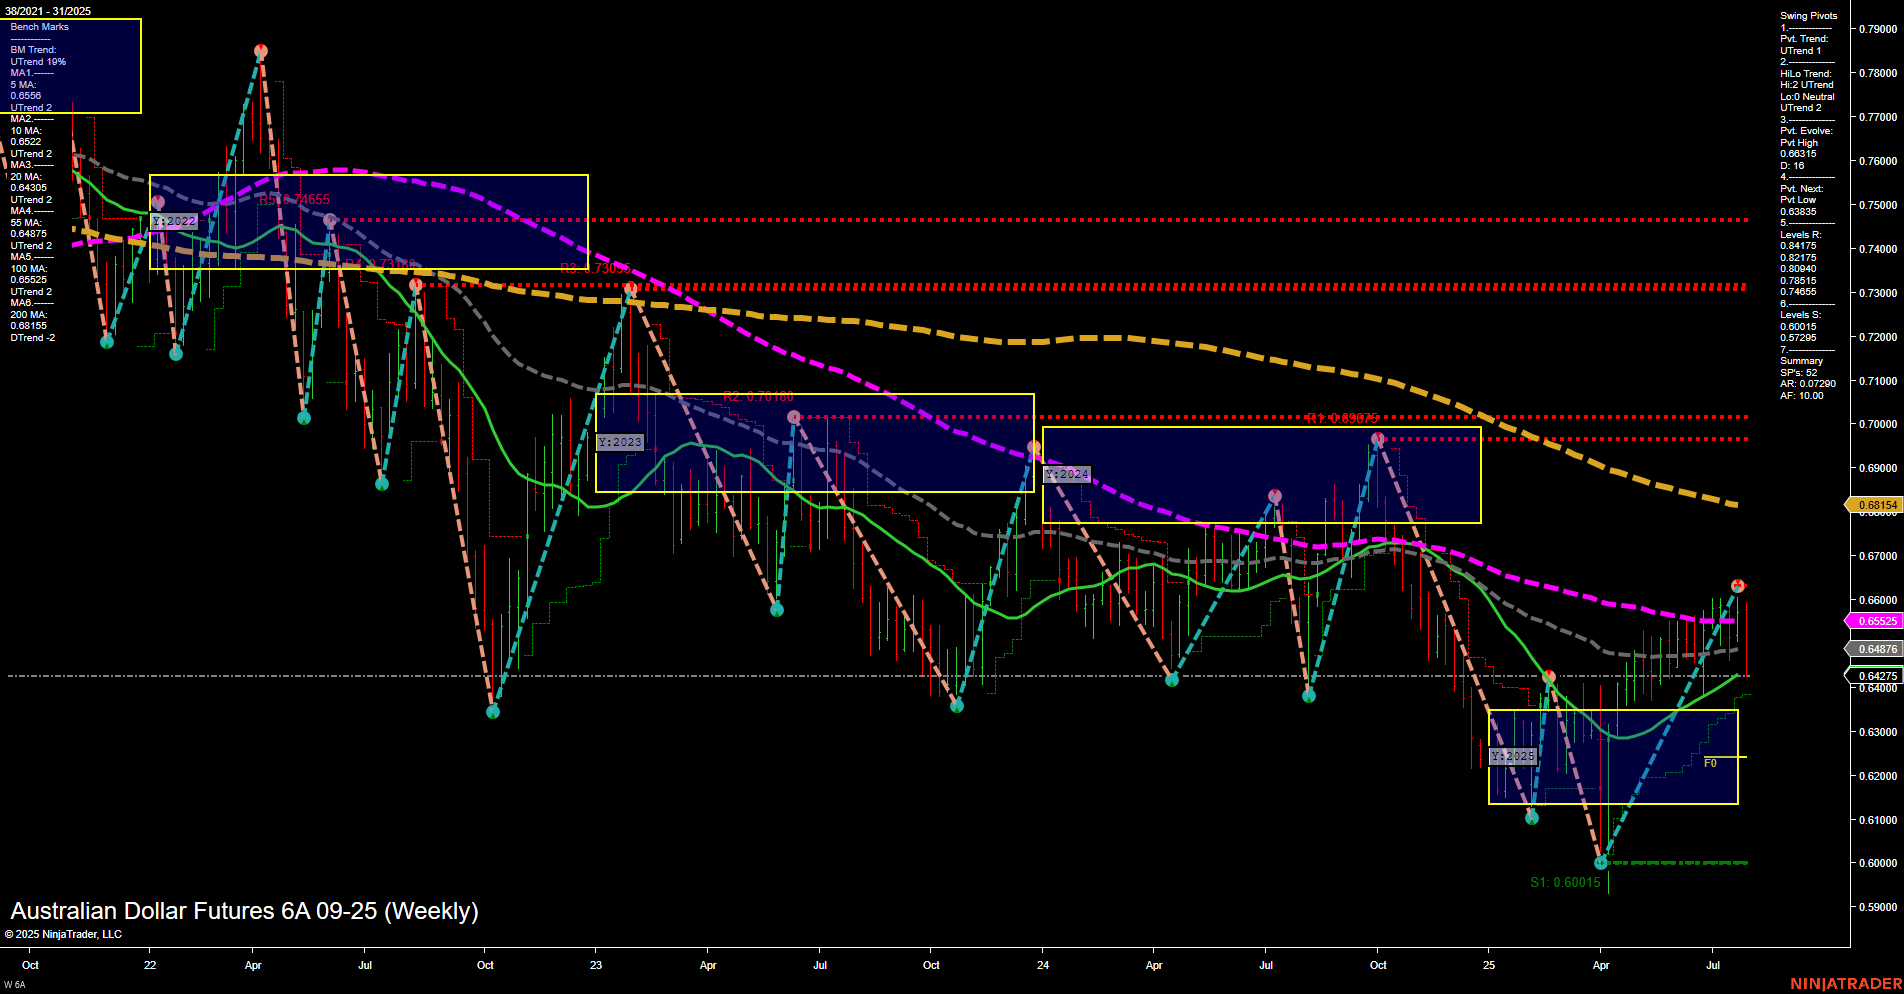
6A Australian Dollar Futures Weekly Chart Analysis: 2025-Aug-01 07:00 CT
Price Action
- Last: 0.64576,
- Bars: Medium,
- Mom: Momentum average.
WSFG Weekly
- Short-Term
- WSFG Current: NA%
- F0%/NTZ' Bias: Price Neutral,
- WSFG Trend: Neutral.
MSFG Month Aug
- Intermediate-Term
- MSFG Current: NA%
- F0%/NTZ' Bias: Price Neutral,
- MSFG Trend: Neutral.
YSFG Year 2025
- Long-Term
- YSFG Current: NA%
- F0%/NTZ' Bias: Price Neutral,
- YSFG Trend: Neutral.
Swing Pivots
- (Short-Term) 1. Pvt. Trend: UTrend,
- (Intermediate-Term) 2. HiLo Trend: DTrend,
- 3. Pvt. Evolve: Pvt high 0.64576,
- 4. Pvt. Next: Pvt low 0.60015,
- 5. Levels R: 0.68154, 0.66972, 0.66155, 0.65523, 0.65085,
- 6. Levels S: 0.60015.
Weekly Benchmarks
- (Intermediate-Term) 5 Week: 0.64230 Up Trend,
- (Intermediate-Term) 10 Week: 0.63883 Up Trend,
- (Long-Term) 20 Week: 0.65523 Up Trend,
- (Long-Term) 55 Week: 0.66155 Down Trend,
- (Long-Term) 100 Week: 0.66972 Down Trend,
- (Long-Term) 200 Week: 0.68154 Down Trend.
Recent Trade Signals
- 30 Jul 2025: Short 6A 09-25 @ 0.64565 Signals.USAR.TR720
Overall Rating
- Short-Term: Bullish,
- Intermediate-Term: Neutral,
- Long-Term: Bearish.
Key Insights Summary
The Australian Dollar Futures (6A) weekly chart shows a recent recovery from a major swing low at 0.60015, with price now testing a swing high at 0.64576. Short-term momentum is average, and the current bar structure is medium, indicating a steady but not aggressive move. The short-term swing pivot trend is up, supported by both the 5- and 10-week moving averages trending higher. However, intermediate-term HiLo trend remains down, and the long-term moving averages (55, 100, 200 week) are still in a downtrend, highlighting persistent overhead resistance. Price is currently below all major long-term resistance levels (0.65085–0.68154), and a recent short signal suggests caution for further upside. The market is in a transition phase, with short-term bullishness facing significant long-term bearish pressure. This setup often leads to choppy or consolidative price action as the market tests and potentially rejects higher levels, especially if it fails to break above the key resistance cluster. The next major support remains at the prior swing low of 0.60015.
Chart Analysis ATS AI Generated: 2025-08-01 07:01 for Informational use only, not trading advice. Terms and Risk Disclosure Copyright © 2025. Algo Trading Systems LLC.
