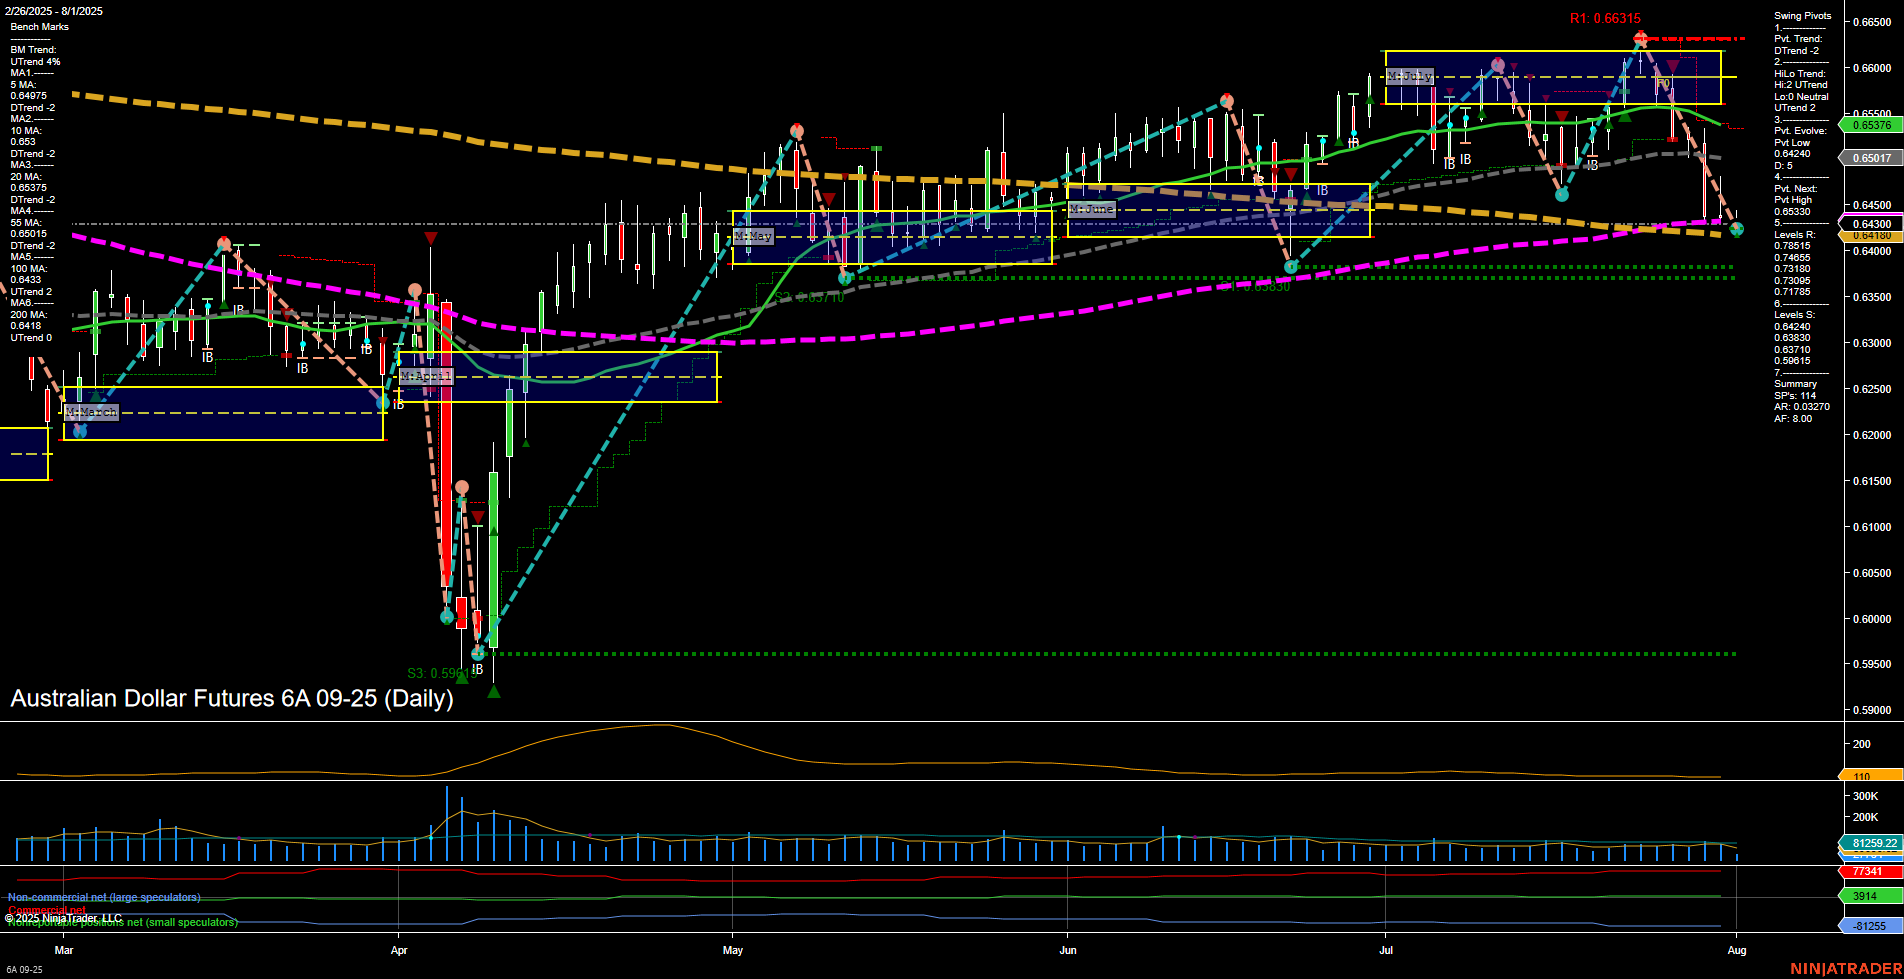
6A Australian Dollar Futures Daily Chart Analysis: 2025-Aug-01 07:00 CT
Price Action
- Last: 0.65376,
- Bars: Medium,
- Mom: Momentum slow.
WSFG Weekly
- Short-Term
- WSFG Current: NA%
- F0%/NTZ' Bias: Price Neutral,
- WSFG Trend: Neutral.
MSFG Month Aug
- Intermediate-Term
- MSFG Current: NA%
- F0%/NTZ' Bias: Price Neutral,
- MSFG Trend: Neutral.
YSFG Year 2025
- Long-Term
- YSFG Current: NA%
- F0%/NTZ' Bias: Price Neutral,
- YSFG Trend: Neutral.
Swing Pivots
- (Short-Term) 1. Pvt. Trend: DTrend,
- (Intermediate-Term) 2. HiLo Trend: UTrend,
- 3. Pvt. Evolve: Pvt low 0.65424,
- 4. Pvt. Next: Pvt high 0.66315,
- 5. Levels R: 0.66315, 0.66140, 0.65815, 0.65330,
- 6. Levels S: 0.65424, 0.65017.
Daily Benchmarks
- (Short-Term) 5 Day: 0.65715 Down Trend,
- (Short-Term) 10 Day: 0.65775 Down Trend,
- (Intermediate-Term) 20 Day: 0.65770 Down Trend,
- (Intermediate-Term) 55 Day: 0.65375 Up Trend,
- (Long-Term) 100 Day: 0.65410 Up Trend,
- (Long-Term) 200 Day: 0.65795 Down Trend.
Additional Metrics
Recent Trade Signals
- 30 Jul 2025: Short 6A 09-25 @ 0.64565 Signals.USAR.TR720
Overall Rating
- Short-Term: Bearish,
- Intermediate-Term: Neutral,
- Long-Term: Neutral.
Key Insights Summary
The 6A Australian Dollar Futures daily chart shows a recent shift to short-term bearishness, with price action breaking below key short-term moving averages and the latest swing pivot evolving to a new low. Momentum is slow, and the bars are medium-sized, indicating a controlled but persistent downward move. The intermediate and long-term trends remain neutral, as the 55-day and 100-day moving averages are still holding uptrends, but the 200-day is in a downtrend, suggesting a broader consolidation phase. Resistance is layered above at 0.65330, 0.65815, 0.66140, and 0.66315, while support is close by at 0.65424 and 0.65017. The recent short signal aligns with the short-term downtrend, but the overall structure suggests the market is in a transition phase, with neither bulls nor bears in full control on the higher timeframes. Volatility (ATR) and volume (VOLMA) are moderate, supporting the view of a market in a corrective or consolidative state rather than a strong trending environment.
Chart Analysis ATS AI Generated: 2025-08-01 07:00 for Informational use only, not trading advice. Terms and Risk Disclosure Copyright © 2025. Algo Trading Systems LLC.
