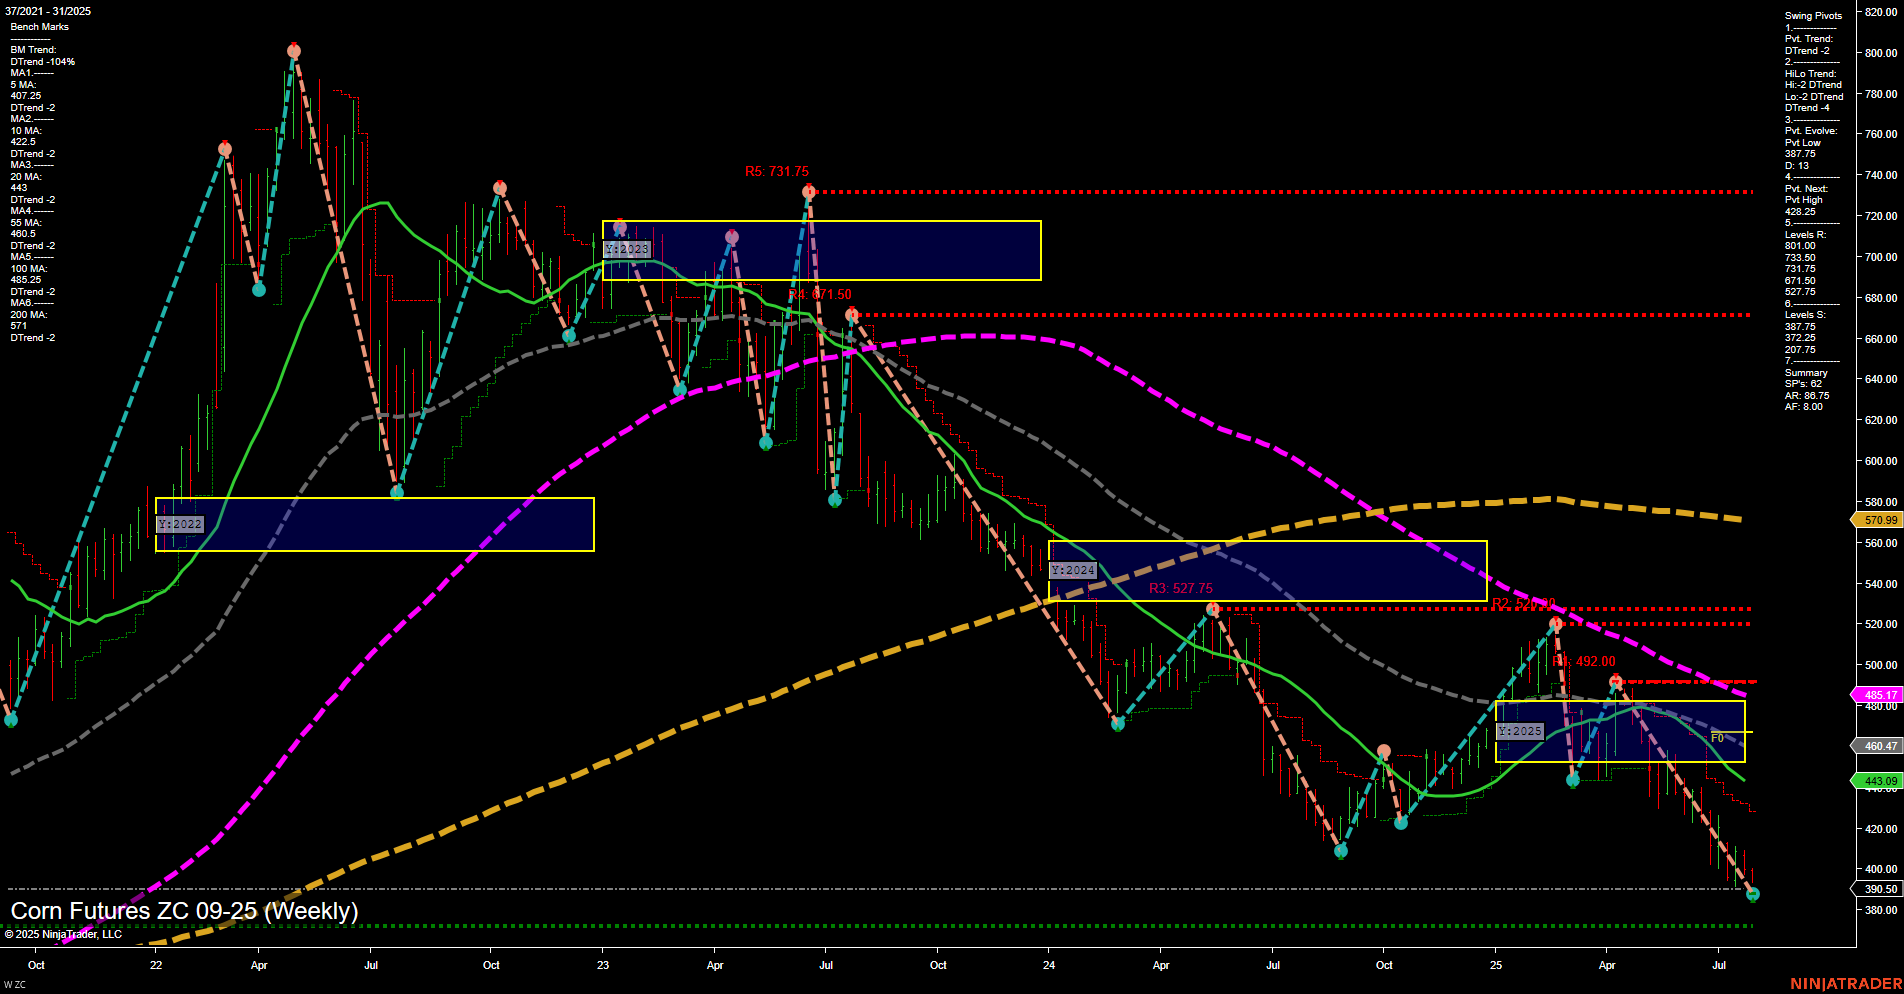
ZC Corn Futures Weekly Chart Analysis: 2025-Jul-31 07:17 CT
Price Action
- Last: 391.00,
- Bars: Medium,
- Mom: Momentum slow.
WSFG Weekly
- Short-Term
- WSFG Current: -44%
- F0%/NTZ' Bias: Price Below,
- WSFG Trend: Down.
MSFG Month Jul
- Intermediate-Term
- MSFG Current: -34%
- F0%/NTZ' Bias: Price Below,
- MSFG Trend: Down.
YSFG Year 2025
- Long-Term
- YSFG Current: -52%
- F0%/NTZ' Bias: Price Below,
- YSFG Trend: Down.
Swing Pivots
- (Short-Term) 1. Pvt. Trend: DTrend,
- (Intermediate-Term) 2. HiLo Trend: DTrend,
- 3. Pvt. Evolve: Pvt low 391.00,
- 4. Pvt. Next: Pvt high 492.00,
- 5. Levels R: 492.00, 527.75, 571.50, 731.75,
- 6. Levels S: 391.00, 372.25, 207.75.
Weekly Benchmarks
- (Intermediate-Term) 5 Week: 445.17 Down Trend,
- (Intermediate-Term) 10 Week: 460.47 Down Trend,
- (Long-Term) 20 Week: 495.07 Down Trend,
- (Long-Term) 55 Week: 570.99 Down Trend,
- (Long-Term) 100 Week: 605.17 Down Trend,
- (Long-Term) 200 Week: 710.99 Down Trend.
Overall Rating
- Short-Term: Bearish,
- Intermediate-Term: Bearish,
- Long-Term: Bearish.
Key Insights Summary
Corn futures continue to exhibit a strong bearish structure across all timeframes, with price action making new swing lows and momentum remaining slow. The market is trading well below all major moving averages, which are all trending down, confirming persistent downside pressure. The most recent swing pivot is a new low at 391.00, with the next significant resistance at 492.00 and further up at 527.75 and 571.50. Support is thin below, with only historical levels at 372.25 and 207.75. The price remains below the NTZ center and all session fib grid benchmarks, reinforcing the dominant downtrend. No signs of reversal or consolidation are present, and the chart reflects a clear trend continuation pattern with lower highs and lower lows. This environment is characterized by weak demand, likely influenced by broader market or fundamental pressures, and offers little evidence of a near-term recovery.
Chart Analysis ATS AI Generated: 2025-07-31 07:18 for Informational use only, not trading advice. Terms and Risk Disclosure Copyright © 2025. Algo Trading Systems LLC.
