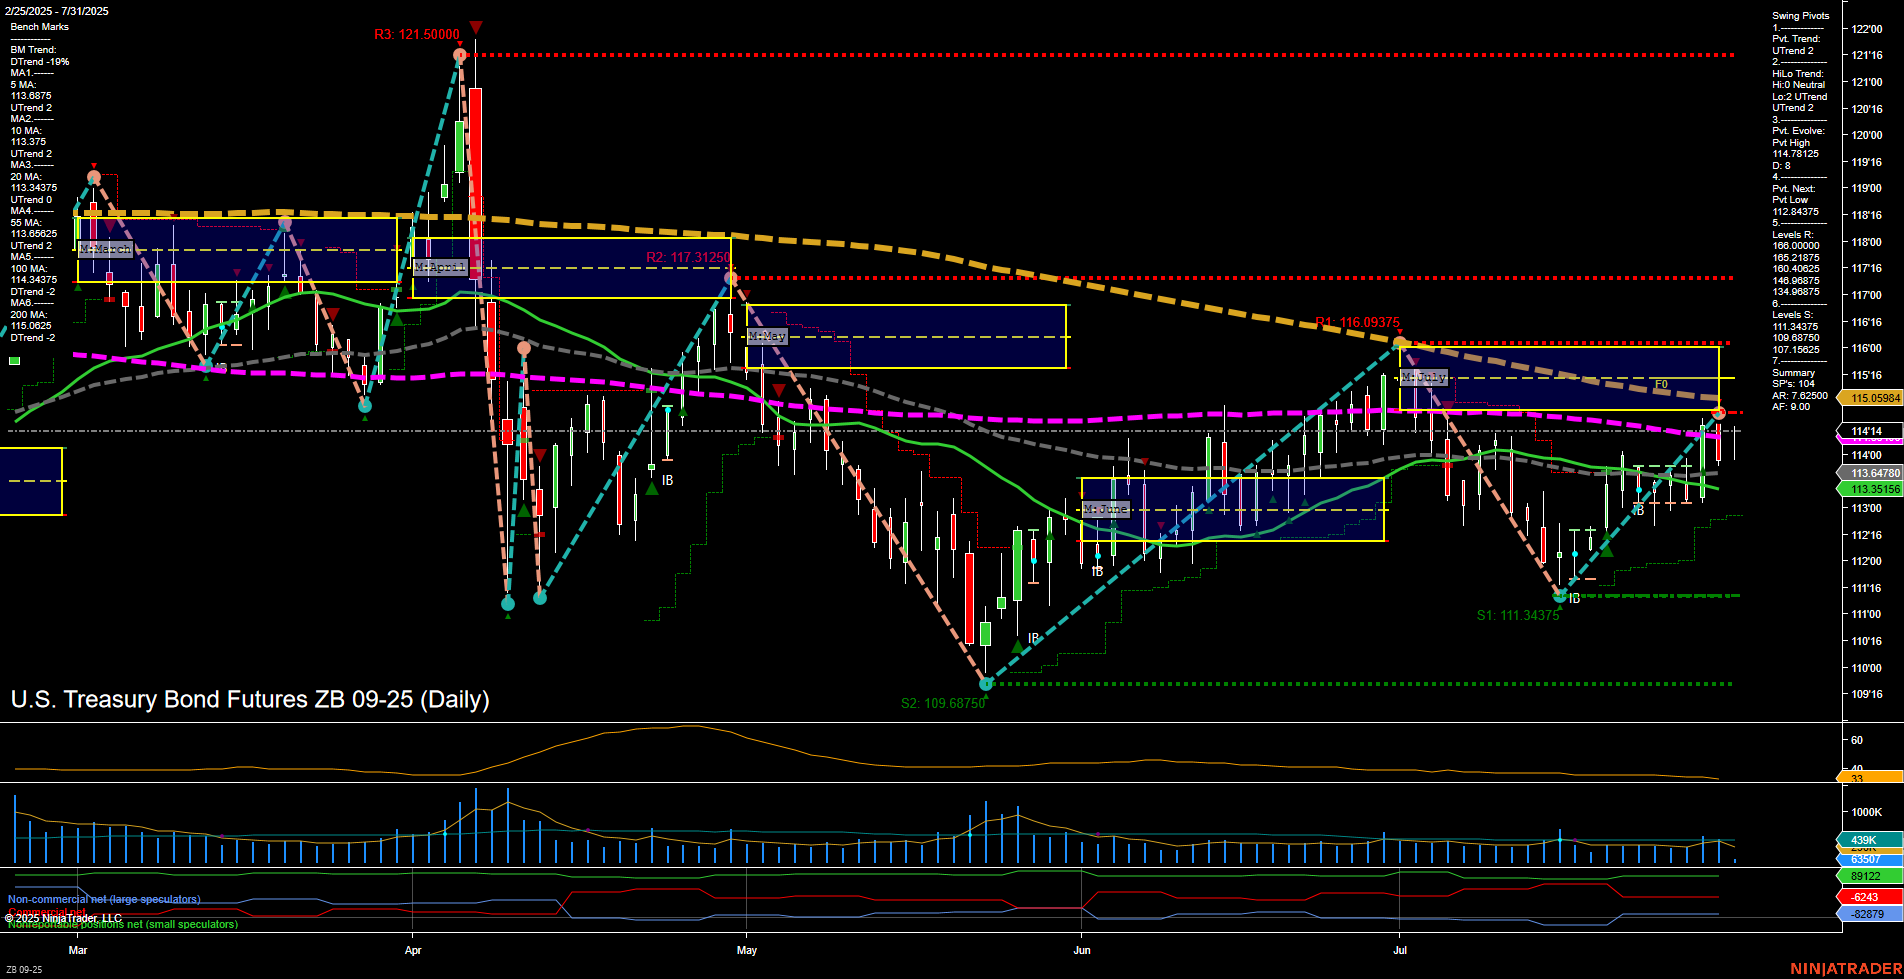
ZB U.S. Treasury Bond Futures Daily Chart Analysis: 2025-Jul-31 07:17 CT
Price Action
- Last: 115.05984,
- Bars: Medium,
- Mom: Momentum average.
WSFG Weekly
- Short-Term
- WSFG Current: NA%
- F0%/NTZ' Bias: Price Neutral,
- WSFG Trend: Neutral.
MSFG Month Jul
- Intermediate-Term
- MSFG Current: NA%
- F0%/NTZ' Bias: Price Neutral,
- MSFG Trend: Neutral.
YSFG Year 2025
- Long-Term
- YSFG Current: NA%
- F0%/NTZ' Bias: Price Neutral,
- YSFG Trend: Neutral.
Swing Pivots
- (Short-Term) 1. Pvt. Trend: UTrend,
- (Intermediate-Term) 2. HiLo Trend: Neutral,
- 3. Pvt. Evolve: Pvt High 114.8125,
- 4. Pvt. Next: Pvt Low 112.84375,
- 5. Levels R: 121.50000, 117.3125, 116.09375, 114.8125,
- 6. Levels S: 111.34375, 109.6875.
Daily Benchmarks
- (Short-Term) 5 Day: 113.6875 Up Trend,
- (Short-Term) 10 Day: 113.375 Up Trend,
- (Intermediate-Term) 20 Day: 113.6478 Up Trend,
- (Intermediate-Term) 55 Day: 114.741 Down Trend,
- (Long-Term) 100 Day: 115.346 Down Trend,
- (Long-Term) 200 Day: 116.6478 Down Trend.
Additional Metrics
Overall Rating
- Short-Term: Bullish,
- Intermediate-Term: Neutral,
- Long-Term: Bearish.
Key Insights Summary
The ZB U.S. Treasury Bond Futures daily chart shows a market in transition. Short-term momentum is positive, with price action above the 5, 10, and 20-day moving averages, all trending upward, and the swing pivot trend confirming an uptrend. However, intermediate-term signals are mixed, with the HiLo trend neutral and price consolidating near key resistance levels. Long-term moving averages (55, 100, 200-day) remain in a downtrend, indicating that the broader bearish structure is still intact. The market is currently testing the 114.8125 swing high resistance, with significant resistance overhead and support at 111.34375 and 109.6875. Volatility is moderate, and volume is steady. The overall environment suggests a short-term bullish bias within a larger consolidation phase, but the long-term trend remains bearish until major resistance levels are reclaimed. Swing traders should note the potential for further upside in the short term, but the broader context is still defined by long-term resistance and a lack of clear breakout above key moving averages.
Chart Analysis ATS AI Generated: 2025-07-31 07:17 for Informational use only, not trading advice. Terms and Risk Disclosure Copyright © 2025. Algo Trading Systems LLC.
