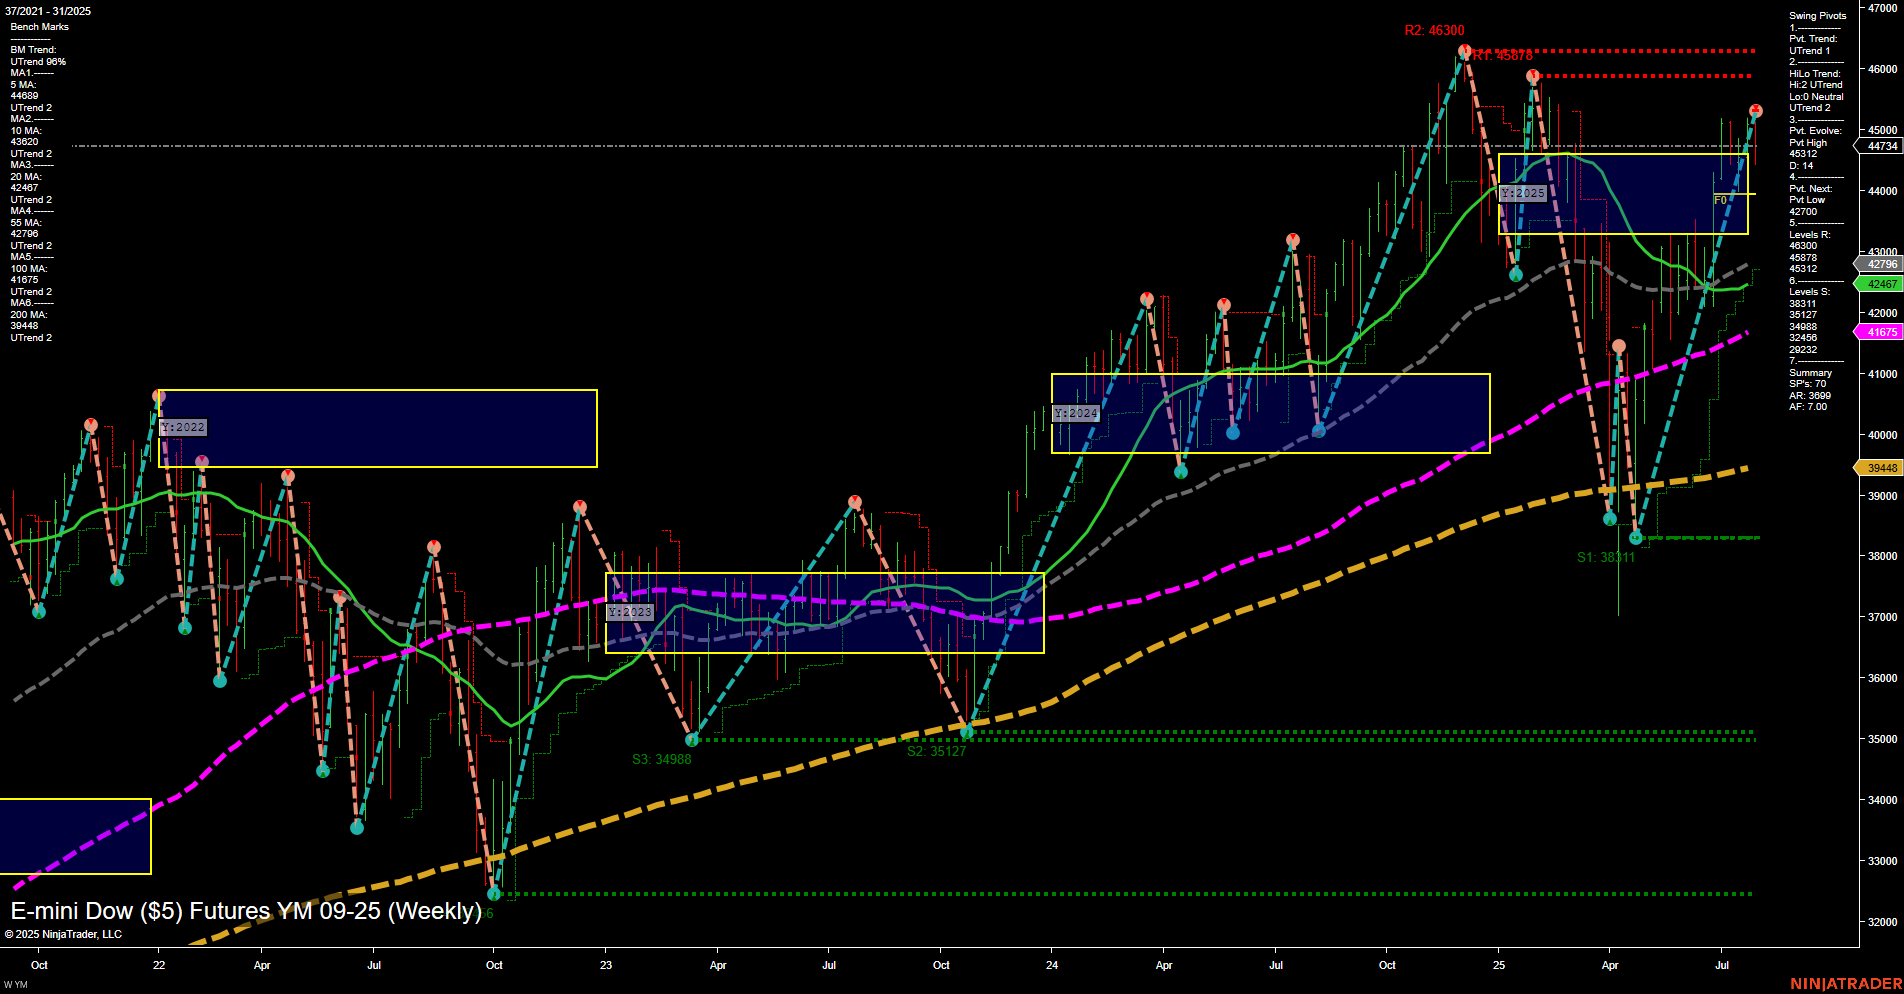
YM E-mini Dow ($5) Futures Weekly Chart Analysis: 2025-Jul-31 07:16 CT
Price Action
- Last: 44734,
- Bars: Medium,
- Mom: Momentum average.
WSFG Weekly
- Short-Term
- WSFG Current: -64%
- F0%/NTZ' Bias: Price Below,
- WSFG Trend: Down.
MSFG Month Jul
- Intermediate-Term
- MSFG Current: 10%
- F0%/NTZ' Bias: Price Above,
- MSFG Trend: Up.
YSFG Year 2025
- Long-Term
- YSFG Current: 12%
- F0%/NTZ' Bias: Price Above,
- YSFG Trend: Up.
Swing Pivots
- (Short-Term) 1. Pvt. Trend: UTrend,
- (Intermediate-Term) 2. HiLo Trend: UTrend,
- 3. Pvt. Evolve: Pvt high 44734,
- 4. Pvt. Next: Pvt low 42700,
- 5. Levels R: 46300, 45878, 44734,
- 6. Levels S: 42796, 42647, 41675, 39448, 38111, 35127, 34988.
Weekly Benchmarks
- (Intermediate-Term) 5 Week: 44690 Up Trend,
- (Intermediate-Term) 10 Week: 43412 Up Trend,
- (Long-Term) 20 Week: 42796 Up Trend,
- (Long-Term) 55 Week: 42647 Up Trend,
- (Long-Term) 100 Week: 41675 Up Trend,
- (Long-Term) 200 Week: 39448 Up Trend.
Recent Trade Signals
- 29 Jul 2025: Short YM 09-25 @ 45069 Signals.USAR-WSFG
- 28 Jul 2025: Short YM 09-25 @ 44957 Signals.USAR.TR120
- 25 Jul 2025: Long YM 09-25 @ 44927 Signals.USAR-MSFG
Overall Rating
- Short-Term: Neutral,
- Intermediate-Term: Bullish,
- Long-Term: Bullish.
Key Insights Summary
The YM E-mini Dow futures weekly chart shows a market in transition. Short-term momentum has slowed, with price currently below the weekly session fib grid (WSFG) neutral zone, and recent short-term signals indicating some downside pressure. However, both intermediate and long-term trends remain bullish, supported by strong upward trends in all major moving averages and price holding above key monthly and yearly fib grid levels. Swing pivots confirm an uptrend in both short and intermediate timeframes, with the most recent pivot high at 44734 and next support at 42700. Resistance is layered above at 44734, 45878, and 46300, while support is well-defined below. The market appears to be consolidating after a strong rally, with potential for further upside if support holds, but short-term choppiness and possible retracement should be monitored. Overall, the structure favors bulls on higher timeframes, while short-term traders may see mixed signals and increased volatility.
Chart Analysis ATS AI Generated: 2025-07-31 07:17 for Informational use only, not trading advice. Terms and Risk Disclosure Copyright © 2025. Algo Trading Systems LLC.
