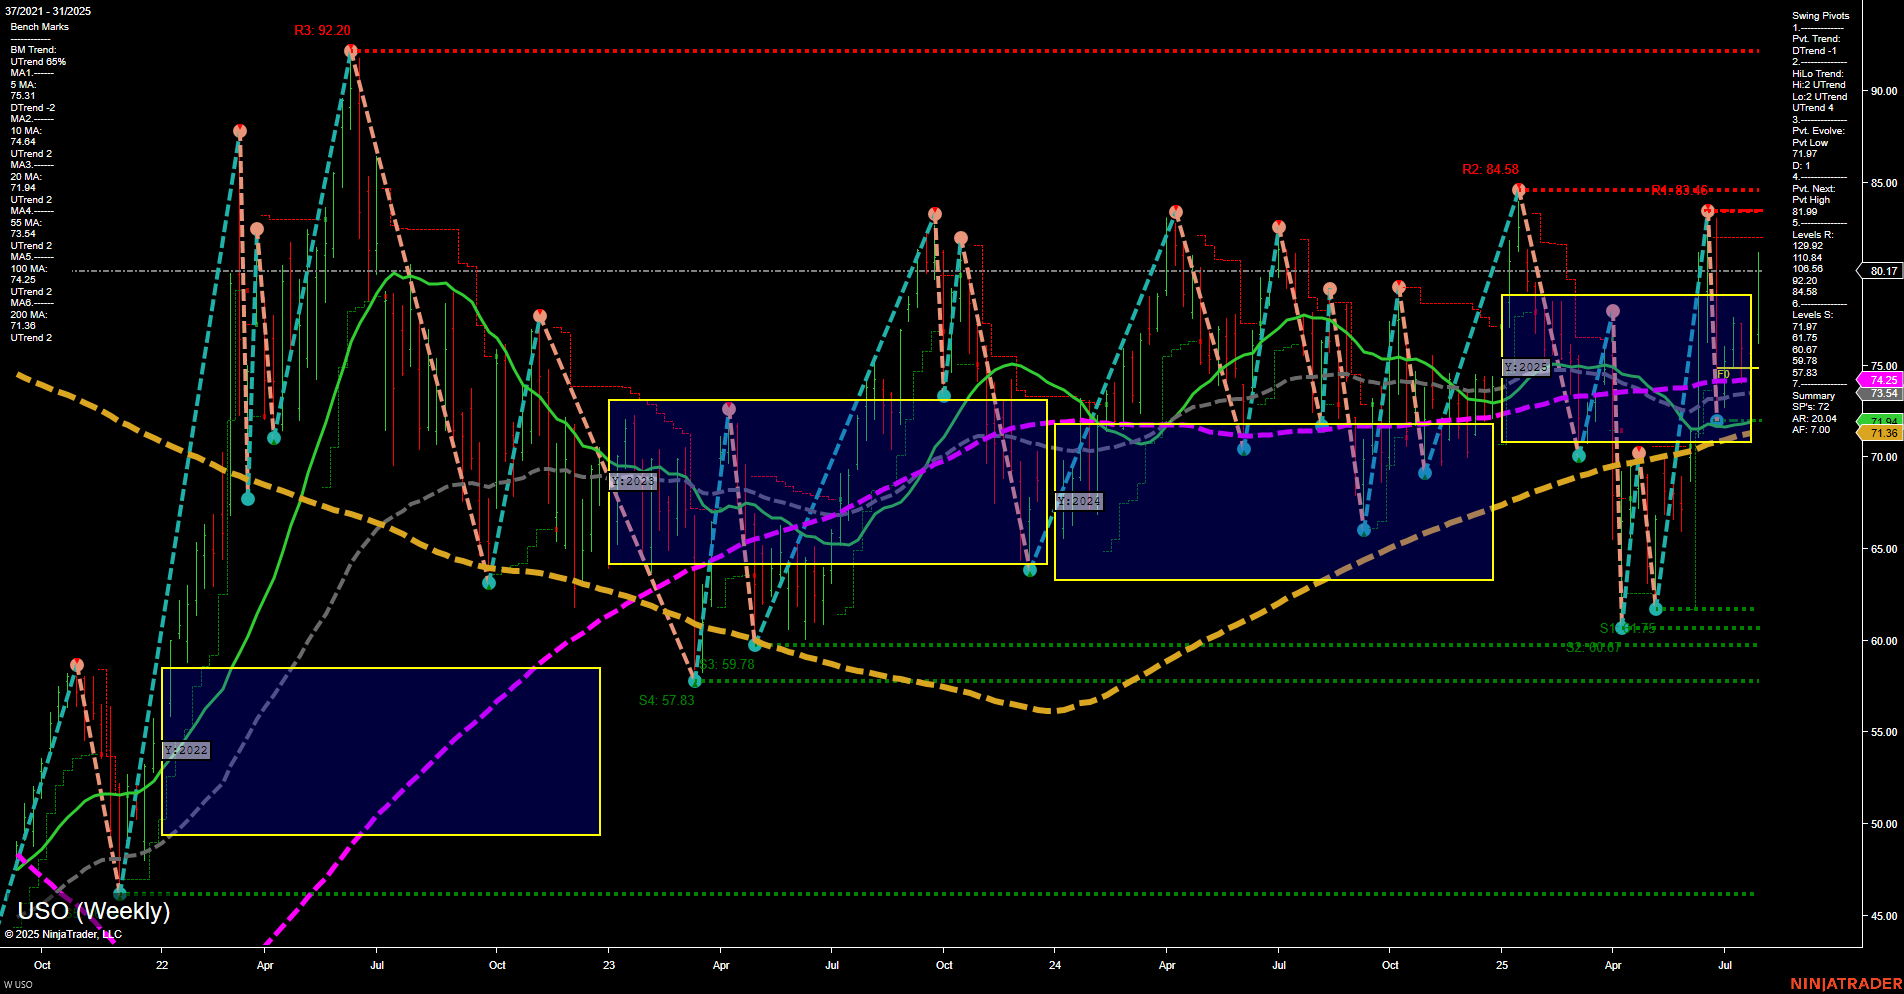
USO United States Oil Fund LP Weekly Chart Analysis: 2025-Jul-31 07:15 CT
Price Action
- Last: 80.13,
- Bars: Large,
- Mom: Momentum fast.
WSFG Weekly
- Short-Term
- WSFG Current: NA%
- F0%/NTZ' Bias: Price Neutral,
- WSFG Trend: Neutral.
MSFG Month Jul
- Intermediate-Term
- MSFG Current: NA%
- F0%/NTZ' Bias: Price Neutral,
- MSFG Trend: Neutral.
YSFG Year 2025
- Long-Term
- YSFG Current: NA%
- F0%/NTZ' Bias: Price Neutral,
- YSFG Trend: Neutral.
Swing Pivots
- (Short-Term) 1. Pvt. Trend: DTrend,
- (Intermediate-Term) 2. HiLo Trend: UTrend,
- 3. Pvt. Evolve: Pvt low 67.75,
- 4. Pvt. Next: Pvt high 83.46,
- 5. Levels R: 92.20, 84.58, 83.46,
- 6. Levels S: 67.75, 66.07, 59.78, 57.83.
Weekly Benchmarks
- (Intermediate-Term) 5 Week: 75.31 Up Trend,
- (Intermediate-Term) 10 Week: 74.64 Up Trend,
- (Long-Term) 20 Week: 77.13 Up Trend,
- (Long-Term) 55 Week: 71.36 Up Trend,
- (Long-Term) 100 Week: 74.25 Down Trend,
- (Long-Term) 200 Week: 73.54 Up Trend.
Overall Rating
- Short-Term: Neutral,
- Intermediate-Term: Bullish,
- Long-Term: Neutral.
Key Insights Summary
USO is currently exhibiting large, fast-moving weekly bars, indicating heightened volatility and strong momentum. The price is trading near 80.13, having recently rebounded from a significant swing low at 67.75. The short-term swing pivot trend is down, but the intermediate-term HiLo trend remains up, suggesting a possible counter-trend rally or a developing consolidation phase. Resistance is stacked above at 83.46, 84.58, and 92.20, while support is well-defined at 67.75 and lower. Most benchmark moving averages (except the 100-week) are trending up, supporting an intermediate-term bullish bias, though the long-term picture is more mixed due to the flattening 100-week MA. The price is oscillating within the yearly NTZ, reflecting a neutral bias on both the short- and long-term session grids. Overall, the market is in a transition zone, with potential for further upside if resistance levels are breached, but also vulnerable to pullbacks if momentum fades. The chart structure suggests a choppy, range-bound environment with the potential for breakout moves as volatility persists.
Chart Analysis ATS AI Generated: 2025-07-31 07:16 for Informational use only, not trading advice. Terms and Risk Disclosure Copyright © 2025. Algo Trading Systems LLC.
