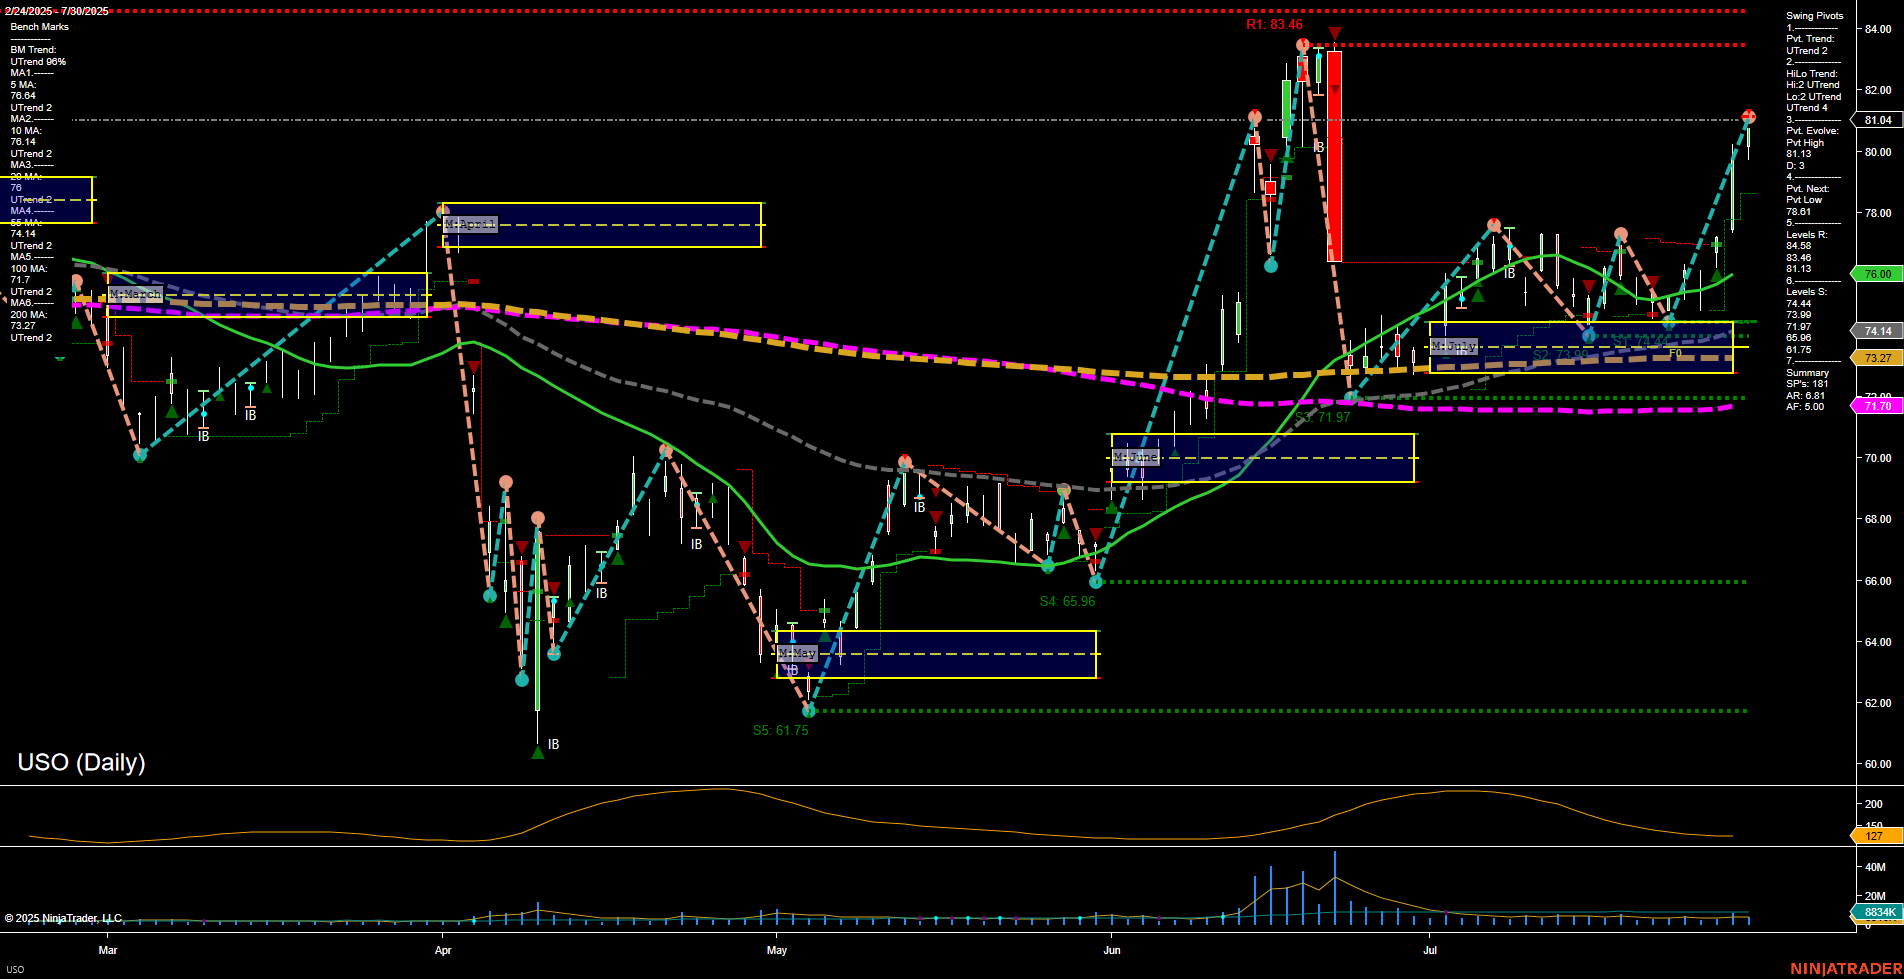
USO United States Oil Fund LP Daily Chart Analysis: 2025-Jul-31 07:15 CT
Price Action
- Last: 81.04,
- Bars: Large,
- Mom: Momentum fast.
WSFG Weekly
- Short-Term
- WSFG Current: NA%
- F0%/NTZ' Bias: Price Neutral,
- WSFG Trend: Neutral.
MSFG Month Jul
- Intermediate-Term
- MSFG Current: NA%
- F0%/NTZ' Bias: Price Neutral,
- MSFG Trend: Neutral.
YSFG Year 2025
- Long-Term
- YSFG Current: NA%
- F0%/NTZ' Bias: Price Neutral,
- YSFG Trend: Neutral.
Swing Pivots
- (Short-Term) 1. Pvt. Trend: UTrend,
- (Intermediate-Term) 2. HiLo Trend: UTrend,
- 3. Pvt. Evolve: Pvt high 81.13,
- 4. Pvt. Next: Pvt low 76.01,
- 5. Levels R: 83.46, 82.00, 81.13,
- 6. Levels S: 76.00, 74.14, 73.27, 71.97, 68.95, 65.96, 61.75.
Daily Benchmarks
- (Short-Term) 5 Day: 78.44 Up Trend,
- (Short-Term) 10 Day: 77.14 Up Trend,
- (Intermediate-Term) 20 Day: 76.00 Up Trend,
- (Intermediate-Term) 55 Day: 73.27 Up Trend,
- (Long-Term) 100 Day: 71.70 Up Trend,
- (Long-Term) 200 Day: 77.10 Up Trend.
Additional Metrics
Overall Rating
- Short-Term: Bullish,
- Intermediate-Term: Bullish,
- Long-Term: Bullish.
Key Insights Summary
USO is exhibiting strong bullish momentum with large price bars and fast momentum, confirmed by an uptrend across all benchmark moving averages from short to long term. The swing pivot structure shows a clear uptrend, with the most recent pivot high at 81.13 and the next potential pivot low at 76.01, indicating a series of higher highs and higher lows. Resistance is layered above at 83.46, 82.00, and 81.13, while support is well-defined below, starting at 76.00 and extending down to 61.75. The ATR and volume metrics suggest heightened volatility and active participation, typical of a trending environment. The neutral bias on the session fib grids (weekly, monthly, yearly) suggests price is not currently at a major inflection zone, allowing the prevailing trend to dominate. Overall, the technical landscape is supportive of continued bullish price action, with the market in a strong uptrend phase and no immediate signs of reversal or exhaustion.
Chart Analysis ATS AI Generated: 2025-07-31 07:15 for Informational use only, not trading advice. Terms and Risk Disclosure Copyright © 2025. Algo Trading Systems LLC.
