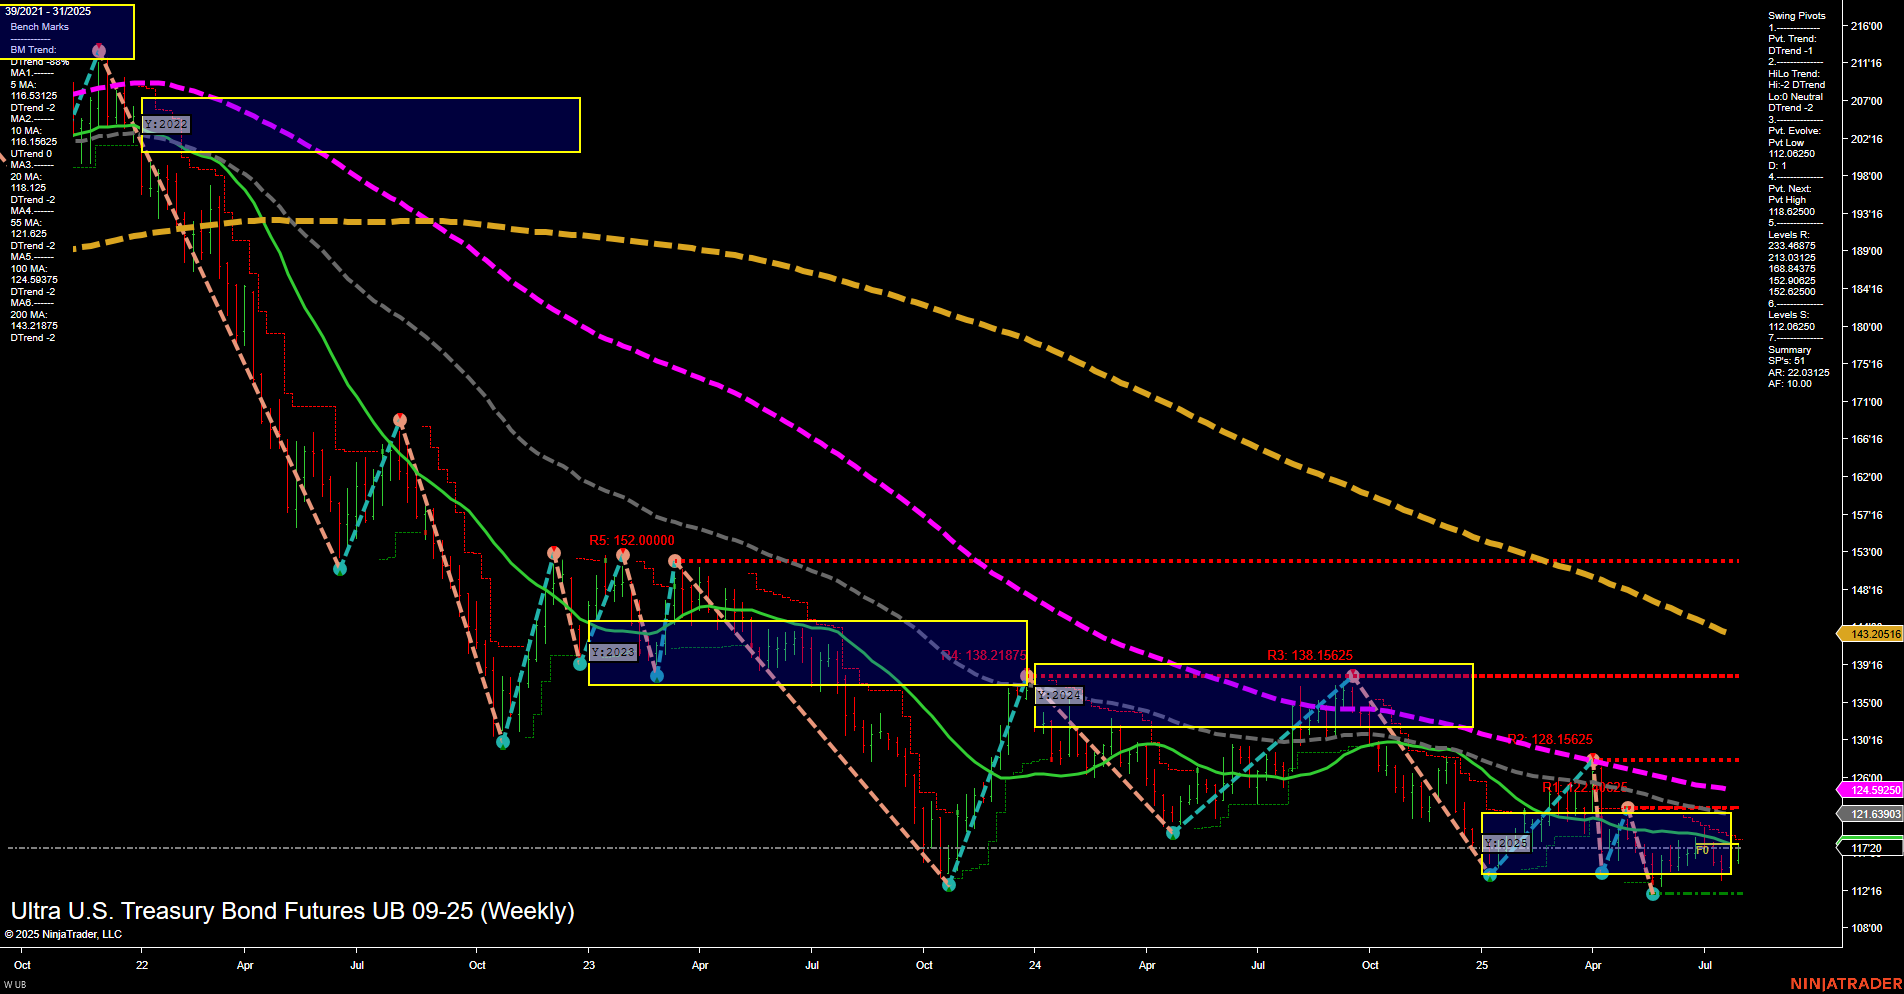
UB Ultra U.S. Treasury Bond Futures Weekly Chart Analysis: 2025-Jul-31 07:15 CT
Price Action
- Last: 121.69305,
- Bars: Medium,
- Mom: Momentum slow.
WSFG Weekly
- Short-Term
- WSFG Current: 62%
- F0%/NTZ' Bias: Price Above,
- WSFG Trend: Up.
MSFG Month Jul
- Intermediate-Term
- MSFG Current: -21%
- F0%/NTZ' Bias: Price Below,
- MSFG Trend: Down.
YSFG Year 2025
- Long-Term
- YSFG Current: -2%
- F0%/NTZ' Bias: Price Below,
- YSFG Trend: Down.
Swing Pivots
- (Short-Term) 1. Pvt. Trend: DTrend,
- (Intermediate-Term) 2. HiLo Trend: DTrend,
- 3. Pvt. Evolve: Pvt Low 112.06250,
- 4. Pvt. Next: Pvt High 118.82813,
- 5. Levels R: 233.40625, 213.84375, 184.03125, 152.00000, 138.21875, 128.15625, 122.90625,
- 6. Levels S: 112.06250.
Weekly Benchmarks
- (Intermediate-Term) 5 Week: 116.59313 Down Trend,
- (Intermediate-Term) 10 Week: 116.9625 Down Trend,
- (Long-Term) 20 Week: 121.12438 Down Trend,
- (Long-Term) 55 Week: 124.5925 Down Trend,
- (Long-Term) 100 Week: 143.20516 Down Trend,
- (Long-Term) 200 Week: 191.28175 Down Trend.
Recent Trade Signals
- 30 Jul 2025: Long UB 09-25 @ 117.71875 Signals.USAR.TR720
- 29 Jul 2025: Long UB 09-25 @ 116.4375 Signals.USAR-WSFG
- 28 Jul 2025: Long UB 09-25 @ 116.59375 Signals.USAR.TR120
Overall Rating
- Short-Term: Neutral,
- Intermediate-Term: Bearish,
- Long-Term: Bearish.
Key Insights Summary
The UB Ultra U.S. Treasury Bond Futures weekly chart shows a market in a prolonged downtrend, with all major long-term and intermediate-term moving averages trending lower and price action remaining below key resistance levels. While the short-term WSFG trend has turned up and recent trade signals have triggered long entries, the overall momentum remains slow and the prevailing swing pivot trends are still downward. The price is currently consolidating near the lower end of its multi-month range, with the most recent swing low at 112.06250 acting as key support and multiple resistance levels overhead. The market is exhibiting signs of a potential short-term bounce or retracement, but the broader context remains bearish, with lower highs and lower lows dominating the chart structure. This environment suggests a choppy, range-bound market with a downward bias, where rallies may be met with selling pressure until a significant shift in trend or a breakout above major resistance occurs.
Chart Analysis ATS AI Generated: 2025-07-31 07:15 for Informational use only, not trading advice. Terms and Risk Disclosure Copyright © 2025. Algo Trading Systems LLC.
