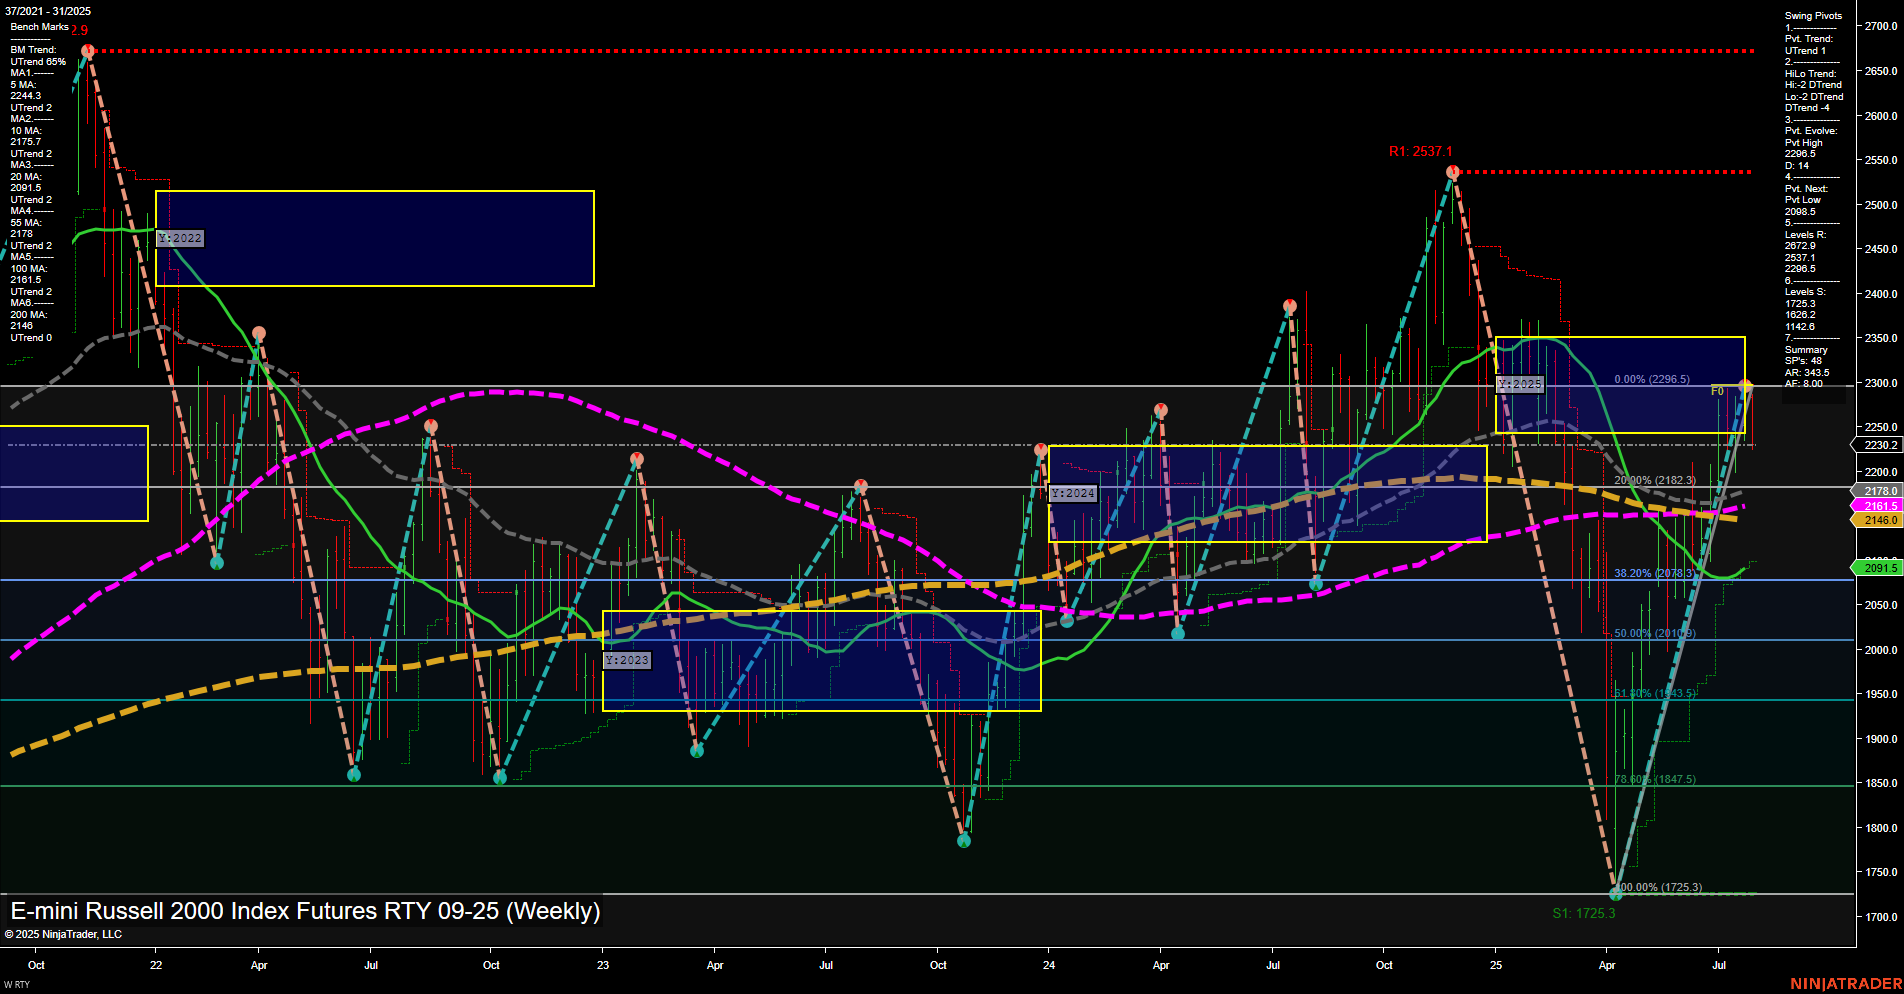
RTY E-mini Russell 2000 Index Futures Weekly Chart Analysis: 2025-Jul-31 07:12 CT
Price Action
- Last: 2244.3,
- Bars: Large,
- Mom: Momentum fast.
WSFG Weekly
- Short-Term
- WSFG Current: -65%
- F0%/NTZ' Bias: Price Below,
- WSFG Trend: Down.
MSFG Month Jul
- Intermediate-Term
- MSFG Current: 17%
- F0%/NTZ' Bias: Price Above,
- MSFG Trend: Up.
YSFG Year 2025
- Long-Term
- YSFG Current: -13%
- F0%/NTZ' Bias: Price Below,
- YSFG Trend: Down.
Swing Pivots
- (Short-Term) 1. Pvt. Trend: UTrend,
- (Intermediate-Term) 2. HiLo Trend: DTrend,
- 3. Pvt. Evolve: Pvt high 2249.6,
- 4. Pvt. Next: Pvt low 2095.5,
- 5. Levels R: 2537.1, 2296.5, 2257.1,
- 6. Levels S: 2095.5, 1725.3.
Weekly Benchmarks
- (Intermediate-Term) 5 Week: 2179.7 Up Trend,
- (Intermediate-Term) 10 Week: 2146.0 Up Trend,
- (Long-Term) 20 Week: 2091.5 Up Trend,
- (Long-Term) 55 Week: 2161.5 Down Trend,
- (Long-Term) 100 Week: 2146.6 Down Trend,
- (Long-Term) 200 Week: 2022.5 Up Trend.
Recent Trade Signals
- 30 Jul 2025: Short RTY 09-25 @ 2263.8 Signals.USAR-WSFG
- 28 Jul 2025: Short RTY 09-25 @ 2264.6 Signals.USAR.TR120
Overall Rating
- Short-Term: Bearish,
- Intermediate-Term: Neutral,
- Long-Term: Bearish.
Key Insights Summary
The RTY is currently experiencing high volatility with large weekly bars and fast momentum, reflecting a dynamic and potentially unstable environment. Short-term technicals are bearish, as indicated by the WSFG trend, price trading below the NTZ center, and recent short trade signals. The swing pivot trend is up in the short-term, but the intermediate HiLo trend remains down, suggesting a possible countertrend rally within a broader downtrend. Intermediate-term metrics are mixed, with the MSFG showing an uptrend and price above the monthly NTZ, but the overall structure is neutral due to conflicting signals between pivots and moving averages. Long-term outlook remains bearish, with the yearly session grid and key long-term moving averages (55 and 100 week) trending down, despite the 200-week MA still in an uptrend. Resistance is clustered near 2257–2296, with major resistance at 2537, while support is found at 2095 and 1725. The market appears to be in a corrective phase after a strong rally, with potential for further downside if support levels are breached, or continued choppy consolidation if buyers defend current levels.
Chart Analysis ATS AI Generated: 2025-07-31 07:13 for Informational use only, not trading advice. Terms and Risk Disclosure Copyright © 2025. Algo Trading Systems LLC.
