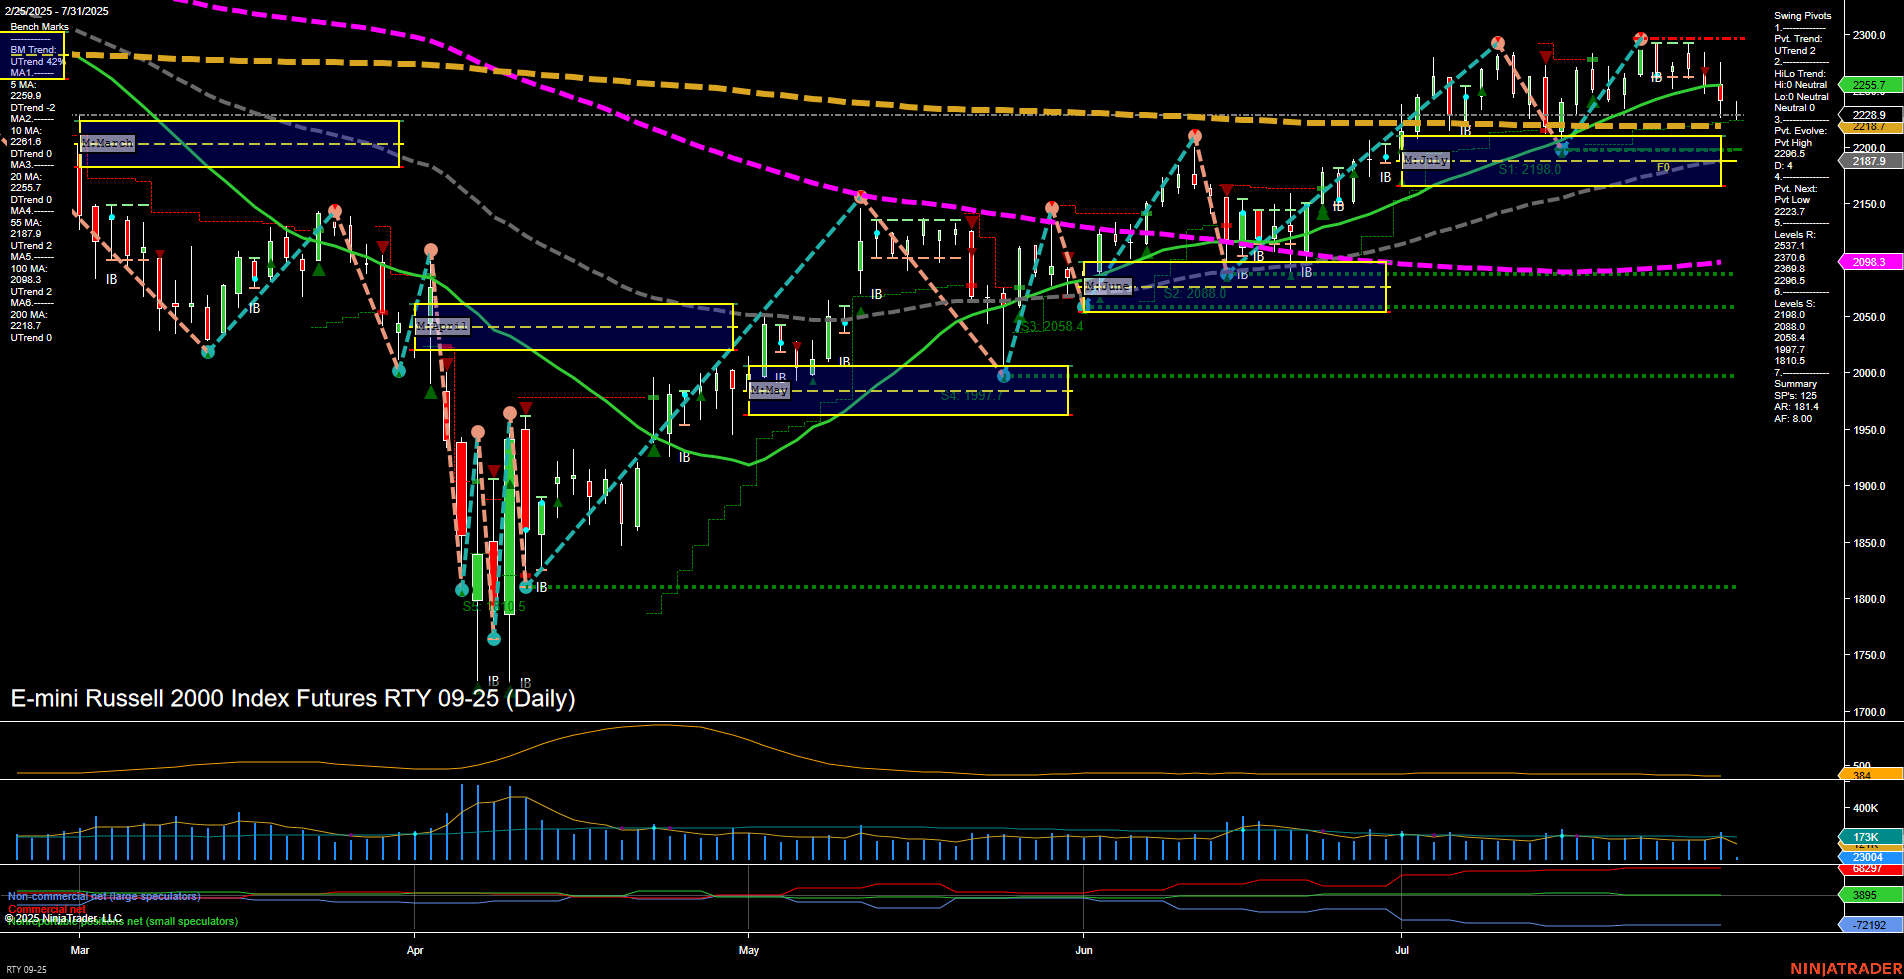
RTY E-mini Russell 2000 Index Futures Daily Chart Analysis: 2025-Jul-31 07:12 CT
Price Action
- Last: 2255.7,
- Bars: Medium,
- Mom: Momentum average.
WSFG Weekly
- Short-Term
- WSFG Current: -65%
- F0%/NTZ' Bias: Price Below,
- WSFG Trend: Down.
MSFG Month Jul
- Intermediate-Term
- MSFG Current: 17%
- F0%/NTZ' Bias: Price Above,
- MSFG Trend: Up.
YSFG Year 2025
- Long-Term
- YSFG Current: -13%
- F0%/NTZ' Bias: Price Below,
- YSFG Trend: Down.
Swing Pivots
- (Short-Term) 1. Pvt. Trend: DTrend,
- (Intermediate-Term) 2. HiLo Trend: Neutral,
- 3. Pvt. Evolve: Pvt High 2296,
- 4. Pvt. Next: Pvt Low 2223.3,
- 5. Levels R: 2296, 2371, 2378, 2380, 2205,
- 6. Levels S: 2223, 2187, 2108, 2088, 2064, 2007, 1810.
Daily Benchmarks
- (Short-Term) 5 Day: 2261.6 Down Trend,
- (Short-Term) 10 Day: 2265.7 Down Trend,
- (Intermediate-Term) 20 Day: 2256.8 Up Trend,
- (Intermediate-Term) 55 Day: 2217.9 Up Trend,
- (Long-Term) 100 Day: 2098.3 Up Trend,
- (Long-Term) 200 Day: 2187.9 Up Trend.
Additional Metrics
Recent Trade Signals
- 30 Jul 2025: Short RTY 09-25 @ 2263.8 Signals.USAR-WSFG
- 28 Jul 2025: Short RTY 09-25 @ 2264.6 Signals.USAR.TR120
Overall Rating
- Short-Term: Bearish,
- Intermediate-Term: Neutral,
- Long-Term: Neutral.
Key Insights Summary
The RTY E-mini Russell 2000 is currently experiencing a short-term pullback, with price action showing average momentum and medium-sized bars. The short-term trend is bearish, as confirmed by the downward WSFG and recent short trade signals, with price trading below the weekly NTZ and both the 5-day and 10-day moving averages trending down. However, the intermediate-term picture is more balanced: the monthly MSFG trend remains up, and the 20-day, 55-day, 100-day, and 200-day moving averages are all in uptrends, suggesting underlying support and a lack of decisive breakdown. Swing pivots indicate a recent pivot high at 2296 and a potential next support at 2223.3, with resistance levels clustered above. The long-term trend is neutral, with the yearly SFG slightly negative but price still above key long-term moving averages. Volatility (ATR) is moderate, and volume is steady. Overall, the market is in a corrective phase within a broader consolidation, with short-term weakness but no clear breakdown of intermediate or long-term support. The environment is choppy, with potential for further retracement toward support, but also resilience from longer-term buyers.
Chart Analysis ATS AI Generated: 2025-07-31 07:12 for Informational use only, not trading advice. Terms and Risk Disclosure Copyright © 2025. Algo Trading Systems LLC.
