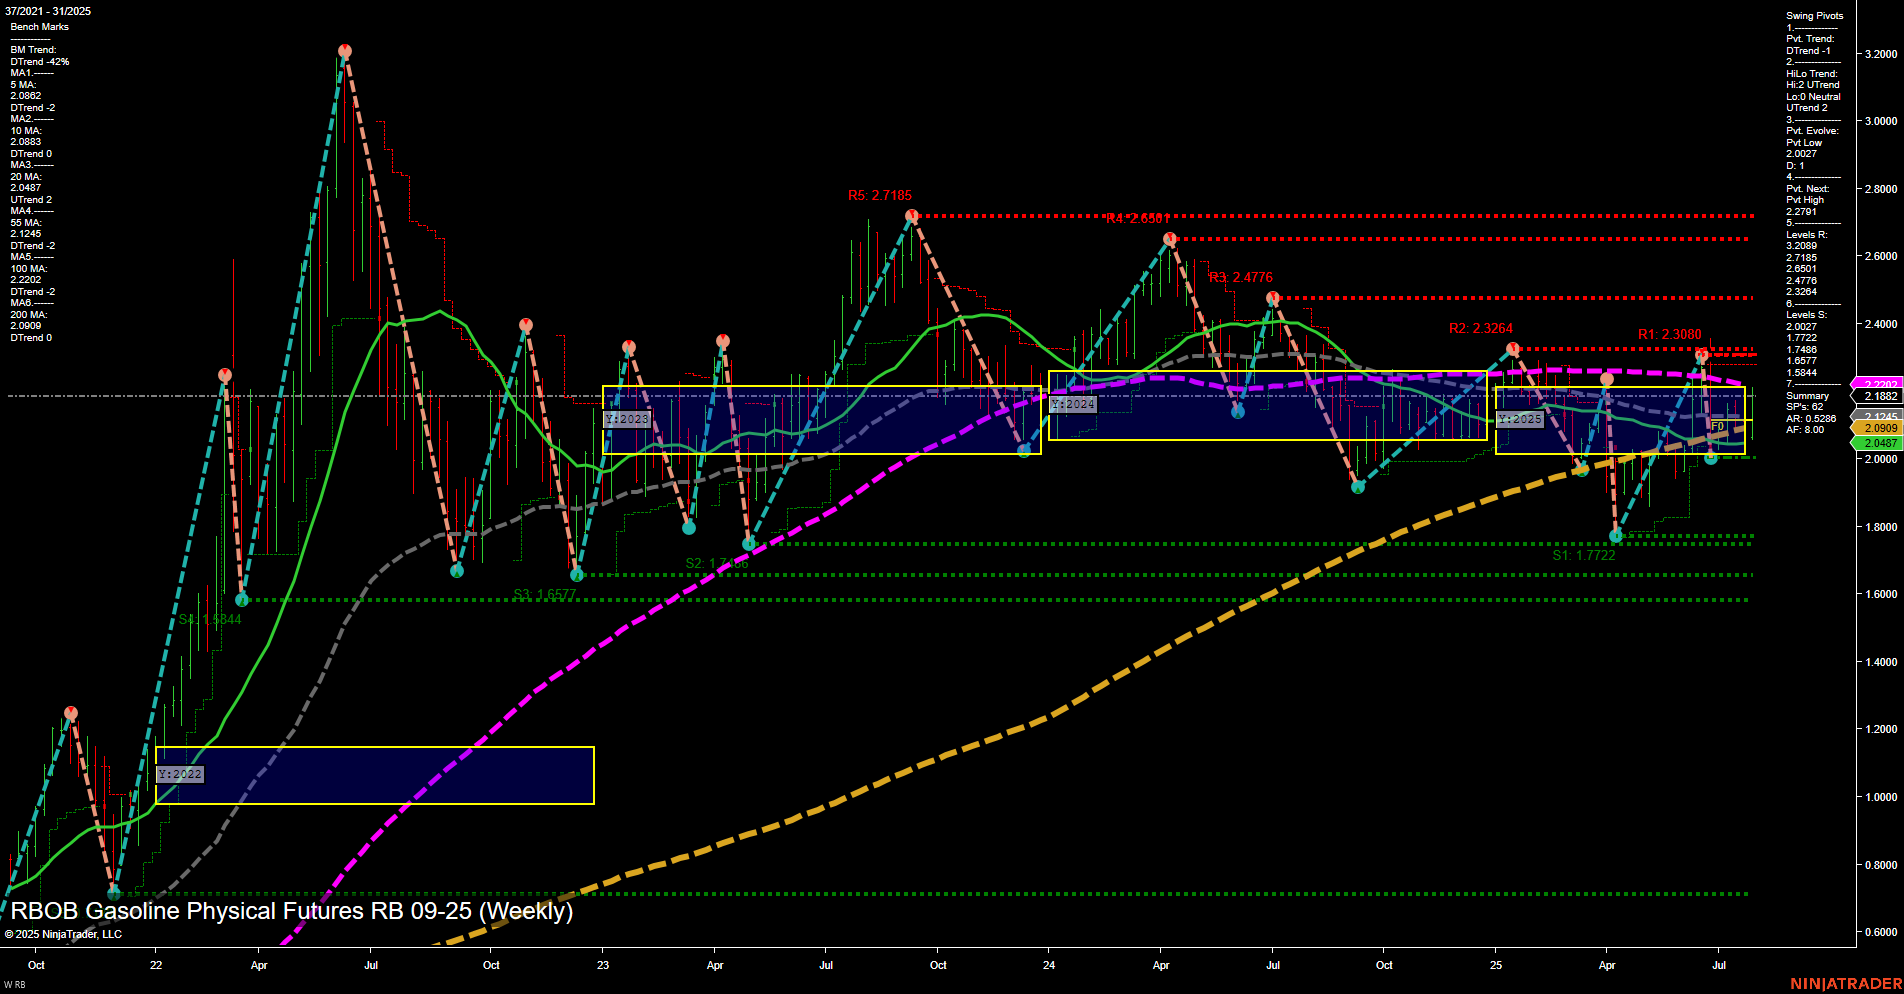
RB RBOB Gasoline Physical Futures Weekly Chart Analysis: 2025-Jul-31 07:12 CT
Price Action
- Last: 2.1034,
- Bars: Medium,
- Mom: Momentum average.
WSFG Weekly
- Short-Term
- WSFG Current: 154%
- F0%/NTZ' Bias: Price Above,
- WSFG Trend: Up.
MSFG Month Jul
- Intermediate-Term
- MSFG Current: 46%
- F0%/NTZ' Bias: Price Above,
- MSFG Trend: Up.
YSFG Year 2025
- Long-Term
- YSFG Current: 7%
- F0%/NTZ' Bias: Price Above,
- YSFG Trend: Up.
Swing Pivots
- (Short-Term) 1. Pvt. Trend: UTrend,
- (Intermediate-Term) 2. HiLo Trend: UTrend,
- 3. Pvt. Evolve: Pvt low 2.027,
- 4. Pvt. Next: Pvt high 2.2091,
- 5. Levels R: 2.7185, 2.6591, 2.4776, 2.3264, 2.3080,
- 6. Levels S: 2.0909, 1.7748, 1.6487, 1.5841, 1.3444.
Weekly Benchmarks
- (Intermediate-Term) 5 Week: 2.0642 Up Trend,
- (Intermediate-Term) 10 Week: 2.0883 Up Trend,
- (Long-Term) 20 Week: 2.0947 Up Trend,
- (Long-Term) 55 Week: 2.1862 Down Trend,
- (Long-Term) 100 Week: 2.2391 Down Trend,
- (Long-Term) 200 Week: 2.0000 Up Trend.
Recent Trade Signals
- 28 Jul 2025: Long RB 09-25 @ 2.1034 Signals.USAR.TR120
- 25 Jul 2025: Short RB 09-25 @ 2.087 Signals.USAR-WSFG
- 24 Jul 2025: Long RB 09-25 @ 2.077 Signals.USAR-MSFG
Overall Rating
- Short-Term: Bullish,
- Intermediate-Term: Bullish,
- Long-Term: Bullish.
Key Insights Summary
The weekly chart for RB RBOB Gasoline Physical Futures as of late July 2025 shows a constructive technical structure across all timeframes. Price is trading above the NTZ center and all major session fib grid levels, with the WSFG, MSFG, and YSFG trends all pointing up, indicating a strong multi-timeframe alignment. Swing pivots confirm an uptrend in both short- and intermediate-term, with the most recent pivot low at 2.027 and the next resistance pivot high at 2.2091. Multiple resistance levels above suggest potential targets if the rally continues, while support is well-defined below, starting at 2.0909. Benchmark moving averages are mostly in uptrends, except for the longer-term 55 and 100 week MAs, which are still lagging and in downtrends, but the 200 week MA is supportive. Recent trade signals have alternated but currently favor the long side, reflecting the prevailing bullish momentum. Overall, the market is in a bullish phase, with price action supported by both trend and structure, and the potential for further upside if resistance levels are overcome.
Chart Analysis ATS AI Generated: 2025-07-31 07:12 for Informational use only, not trading advice. Terms and Risk Disclosure Copyright © 2025. Algo Trading Systems LLC.
