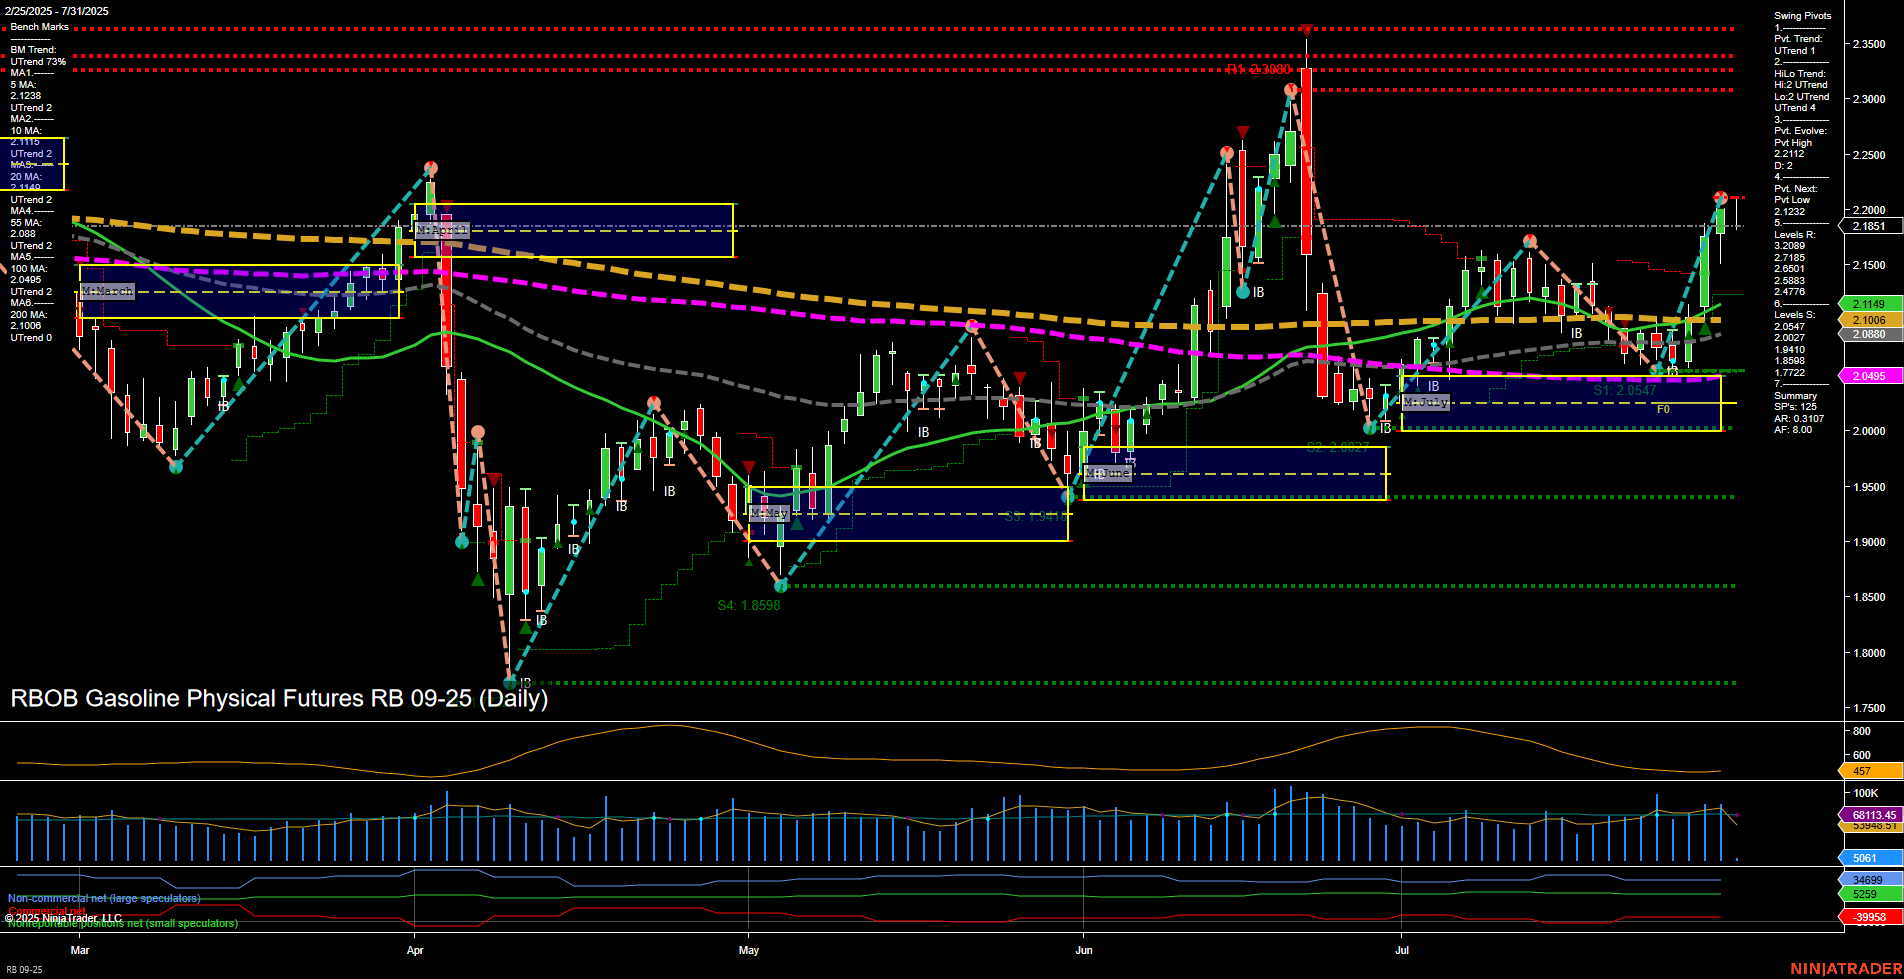
RB RBOB Gasoline Physical Futures Daily Chart Analysis: 2025-Jul-31 07:11 CT
Price Action
- Last: 2.1851,
- Bars: Large,
- Mom: Momentum fast.
WSFG Weekly
- Short-Term
- WSFG Current: 154%
- F0%/NTZ' Bias: Price Above,
- WSFG Trend: Up.
MSFG Month Jul
- Intermediate-Term
- MSFG Current: 46%
- F0%/NTZ' Bias: Price Above,
- MSFG Trend: Up.
YSFG Year 2025
- Long-Term
- YSFG Current: 7%
- F0%/NTZ' Bias: Price Above,
- YSFG Trend: Up.
Swing Pivots
- (Short-Term) 1. Pvt. Trend: UTrend,
- (Intermediate-Term) 2. HiLo Trend: UTrend,
- 3. Pvt. Evolve: Pvt High 2.2112,
- 4. Pvt. Next: Pvt Low 2.1232,
- 5. Levels R: 2.3000, 2.2850, 2.2500, 2.2112,
- 6. Levels S: 2.1232, 2.0850, 2.0547, 1.9868, 1.8598.
Daily Benchmarks
- (Short-Term) 5 Day: 2.1238 Up Trend,
- (Short-Term) 10 Day: 2.1106 Up Trend,
- (Intermediate-Term) 20 Day: 2.1149 Up Trend,
- (Intermediate-Term) 55 Day: 2.0850 Up Trend,
- (Long-Term) 100 Day: 2.0495 Up Trend,
- (Long-Term) 200 Day: 2.0104 Up Trend.
Additional Metrics
Recent Trade Signals
- 28 Jul 2025: Long RB 09-25 @ 2.1034 Signals.USAR.TR120
- 25 Jul 2025: Short RB 09-25 @ 2.087 Signals.USAR-WSFG
- 24 Jul 2025: Long RB 09-25 @ 2.077 Signals.USAR-MSFG
Overall Rating
- Short-Term: Bullish,
- Intermediate-Term: Bullish,
- Long-Term: Bullish.
Key Insights Summary
The RBOB Gasoline futures market is demonstrating strong bullish momentum across all timeframes. Price has broken above key NTZ (neutral trading zone) levels on the weekly, monthly, and yearly session fib grids, confirming an upward bias. The most recent price action features large, fast-moving bars, indicating strong buying interest and a potential breakout environment. All benchmark moving averages from short to long term are trending upward, reinforcing the prevailing uptrend. Swing pivot analysis shows the current trend is up, with the most recent pivot high at 2.2112 and the next significant support at 2.1232. Resistance levels are layered above, with 2.3000 as a major target. Volatility (ATR) and volume (VOLMA) are elevated, supporting the case for continued active trading conditions. Recent trade signals have favored the long side, aligning with the technical structure. Overall, the market is in a bullish phase, with higher lows and higher highs, and is currently in a trend continuation mode following a period of consolidation and breakout.
Chart Analysis ATS AI Generated: 2025-07-31 07:12 for Informational use only, not trading advice. Terms and Risk Disclosure Copyright © 2025. Algo Trading Systems LLC.
