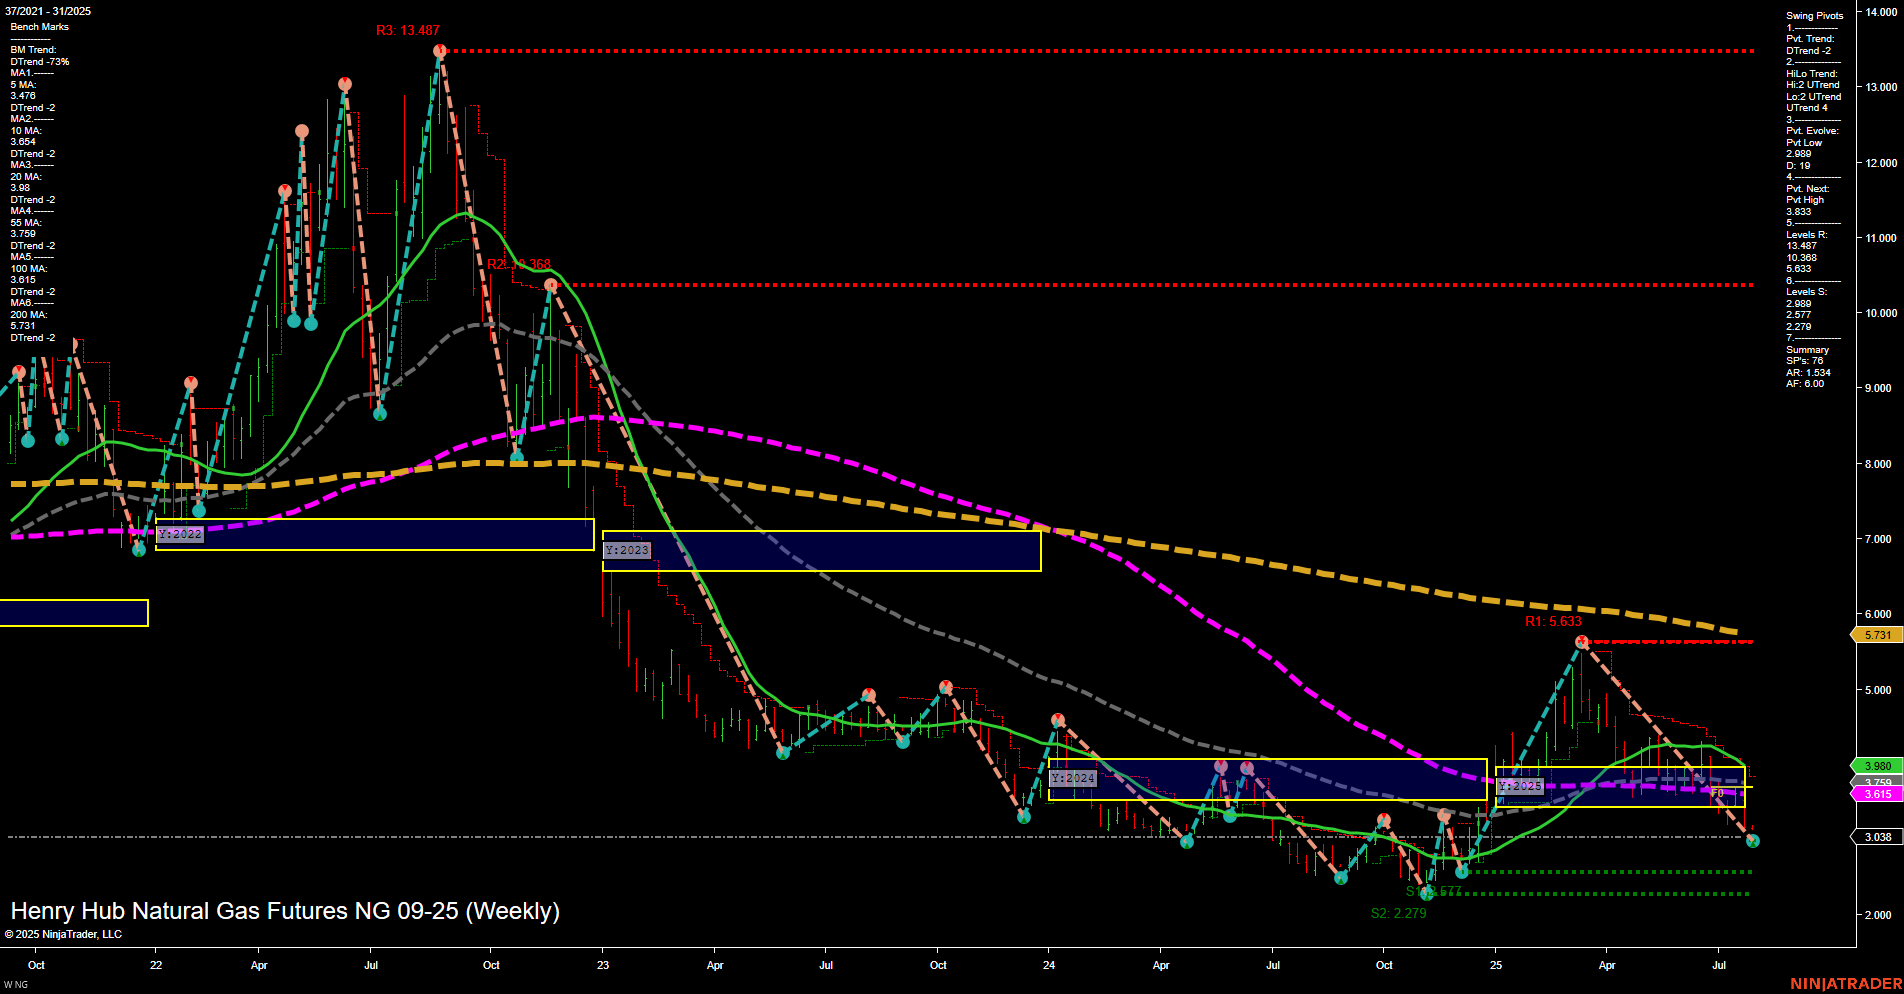
NG Henry Hub Natural Gas Futures Weekly Chart Analysis: 2025-Jul-31 07:09 CT
Price Action
- Last: 3.038,
- Bars: Medium,
- Mom: Momentum slow.
WSFG Weekly
- Short-Term
- WSFG Current: NA%
- F0%/NTZ' Bias: Price Neutral,
- WSFG Trend: Neutral.
MSFG Month Jul
- Intermediate-Term
- MSFG Current: NA%
- F0%/NTZ' Bias: Price Neutral,
- MSFG Trend: Neutral.
YSFG Year 2025
- Long-Term
- YSFG Current: NA%
- F0%/NTZ' Bias: Price Neutral,
- YSFG Trend: Neutral.
Swing Pivots
- (Short-Term) 1. Pvt. Trend: DTrend,
- (Intermediate-Term) 2. HiLo Trend: DTrend,
- 3. Pvt. Evolve: Pvt low 2.109,
- 4. Pvt. Next: Pvt high 3.833,
- 5. Levels R: 13.487, 10.388, 6.338, 5.633,
- 6. Levels S: 2.697, 2.279, 2.277.
Weekly Benchmarks
- (Intermediate-Term) 5 Week: 3.374 Down Trend,
- (Intermediate-Term) 10 Week: 3.064 Down Trend,
- (Long-Term) 20 Week: 3.980 Down Trend,
- (Long-Term) 55 Week: 5.754 Down Trend,
- (Long-Term) 100 Week: 6.615 Down Trend,
- (Long-Term) 200 Week: 7.573 Down Trend.
Overall Rating
- Short-Term: Bearish,
- Intermediate-Term: Bearish,
- Long-Term: Bearish.
Key Insights Summary
The weekly chart for Henry Hub Natural Gas Futures shows a persistent bearish structure across all timeframes. Price action is subdued, with medium-sized bars and slow momentum, indicating a lack of strong directional conviction. The price is trading well below all major moving averages, which are all trending down, reinforcing the dominant downtrend. Swing pivot analysis highlights a recent pivot low at 2.109, with the next significant resistance at 3.833, and major resistance levels much higher, suggesting any rallies may face strong overhead supply. Support is clustered just below current prices, with the lowest at 2.277. The neutral bias in the session fib grids (WSFG, MSFG, YSFG) suggests a lack of immediate reversal signals, and the overall technical landscape points to continued consolidation or further downside unless a significant catalyst emerges. The market appears to be in a prolonged corrective phase, with no clear signs of a bullish reversal at this stage.
Chart Analysis ATS AI Generated: 2025-07-31 07:09 for Informational use only, not trading advice. Terms and Risk Disclosure Copyright © 2025. Algo Trading Systems LLC.
