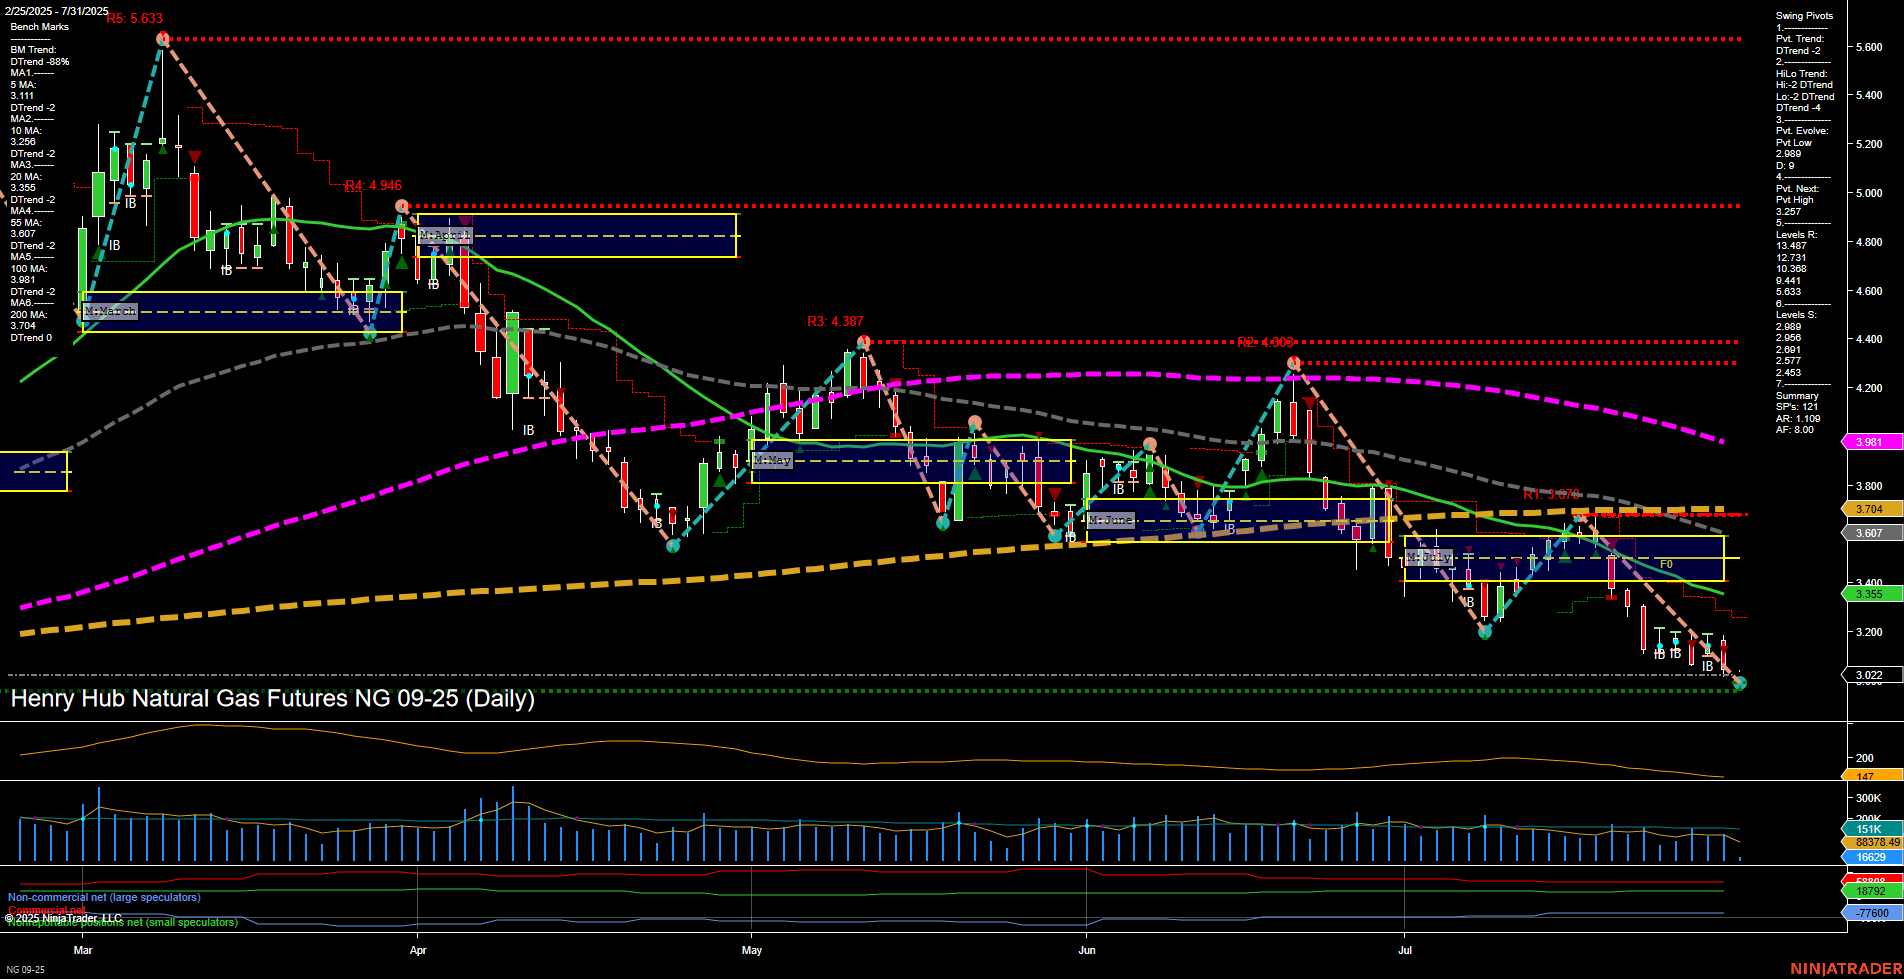
NG Henry Hub Natural Gas Futures Daily Chart Analysis: 2025-Jul-31 07:09 CT
Price Action
- Last: 3.022,
- Bars: Medium,
- Mom: Momentum slow.
WSFG Weekly
- Short-Term
- WSFG Current: NA%
- F0%/NTZ' Bias: Price Neutral,
- WSFG Trend: Neutral.
MSFG Month Jul
- Intermediate-Term
- MSFG Current: NA%
- F0%/NTZ' Bias: Price Neutral,
- MSFG Trend: Neutral.
YSFG Year 2025
- Long-Term
- YSFG Current: NA%
- F0%/NTZ' Bias: Price Neutral,
- YSFG Trend: Neutral.
Swing Pivots
- (Short-Term) 1. Pvt. Trend: DTrend,
- (Intermediate-Term) 2. HiLo Trend: DTrend,
- 3. Pvt. Evolve: Pvt low 3.022,
- 4. Pvt. Next: Pvt high 3.267,
- 5. Levels R: 4.946, 4.387, 4.090, 3.607, 3.355,
- 6. Levels S: 3.022.
Daily Benchmarks
- (Short-Term) 5 Day: 3.111 Down Trend,
- (Short-Term) 10 Day: 3.256 Down Trend,
- (Intermediate-Term) 20 Day: 3.607 Down Trend,
- (Intermediate-Term) 55 Day: 3.704 Down Trend,
- (Long-Term) 100 Day: 3.981 Down Trend,
- (Long-Term) 200 Day: 4.400 Down Trend.
Additional Metrics
Overall Rating
- Short-Term: Bearish,
- Intermediate-Term: Bearish,
- Long-Term: Bearish.
Key Insights Summary
Natural gas futures are exhibiting a clear bearish structure across all timeframes. Price action has been characterized by medium-sized bars and slow momentum, with the last price at 3.022 marking a new swing low. Both short-term and intermediate-term swing pivot trends are down, and all major moving averages (from 5-day to 200-day) are trending lower, confirming persistent downside pressure. Resistance levels are stacked well above current price, while support is now defined at the recent low. The ATR and volume metrics suggest moderate volatility and steady participation, but there is no sign of reversal or strong buying interest. The market remains in a prolonged downtrend, with no technical evidence of a bottom or reversal at this stage. The environment is dominated by trend continuation and lower lows, with price consolidating near support and no bullish catalysts visible on the chart.
Chart Analysis ATS AI Generated: 2025-07-31 07:09 for Informational use only, not trading advice. Terms and Risk Disclosure Copyright © 2025. Algo Trading Systems LLC.
