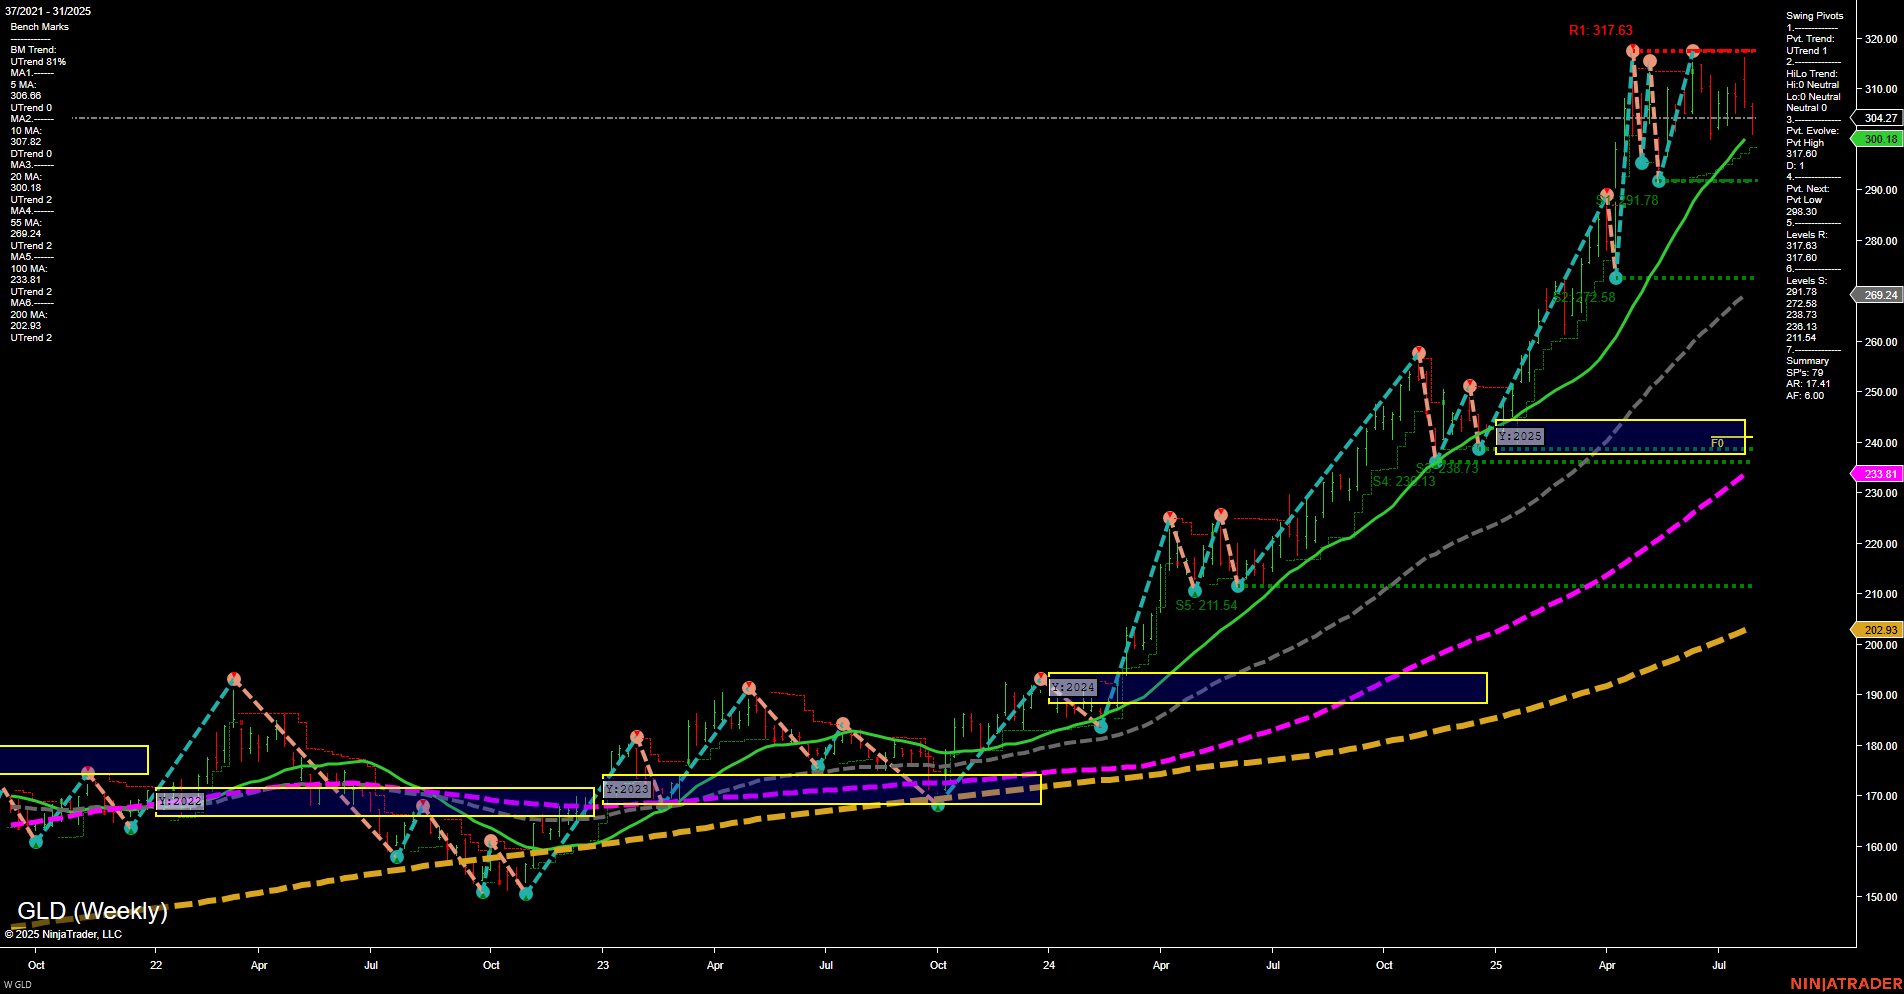
GLD SPDR Gold Shares Weekly Chart Analysis: 2025-Jul-31 07:08 CT
Price Action
- Last: 304.27,
- Bars: Medium,
- Mom: Momentum slow.
WSFG Weekly
- Short-Term
- WSFG Current: NA%
- F0%/NTZ' Bias: Price Neutral,
- WSFG Trend: Neutral.
MSFG Month Jul
- Intermediate-Term
- MSFG Current: NA%
- F0%/NTZ' Bias: Price Neutral,
- MSFG Trend: Neutral.
YSFG Year 2025
- Long-Term
- YSFG Current: NA%
- F0%/NTZ' Bias: Price Neutral,
- YSFG Trend: Neutral.
Swing Pivots
- (Short-Term) 1. Pvt. Trend: UTrend,
- (Intermediate-Term) 2. HiLo Trend: UTrend,
- 3. Pvt. Evolve: Pvt high 317.63,
- 4. Pvt. Next: Pvt low 300.18,
- 5. Levels R: 317.63,
- 6. Levels S: 300.18, 269.24, 228.78, 211.54.
Weekly Benchmarks
- (Intermediate-Term) 5 Week: 306.08 Up Trend,
- (Intermediate-Term) 10 Week: 307.82 Up Trend,
- (Long-Term) 20 Week: 291.78 Up Trend,
- (Long-Term) 55 Week: 260.24 Up Trend,
- (Long-Term) 100 Week: 233.81 Up Trend,
- (Long-Term) 200 Week: 202.93 Up Trend.
Overall Rating
- Short-Term: Neutral,
- Intermediate-Term: Bullish,
- Long-Term: Bullish.
Key Insights Summary
GLD has experienced a strong multi-month rally, with price action consolidating near all-time highs. The weekly chart shows a clear uptrend in both intermediate and long-term moving averages, with all benchmarks trending higher. Swing pivots indicate the most recent high at 317.63 and a key support at 300.18, suggesting a range-bound consolidation after a significant advance. Momentum has slowed, and the current bar structure is medium-sized, reflecting a pause or digestion phase. The Fib grid and NTZ zones are neutral, indicating no immediate directional bias. Overall, the structure remains bullish on higher timeframes, with the short-term outlook neutral as the market consolidates gains. This environment is typical of a market in a holding pattern after a strong trend, awaiting new catalysts for the next directional move.
Chart Analysis ATS AI Generated: 2025-07-31 07:09 for Informational use only, not trading advice. Terms and Risk Disclosure Copyright © 2025. Algo Trading Systems LLC.
