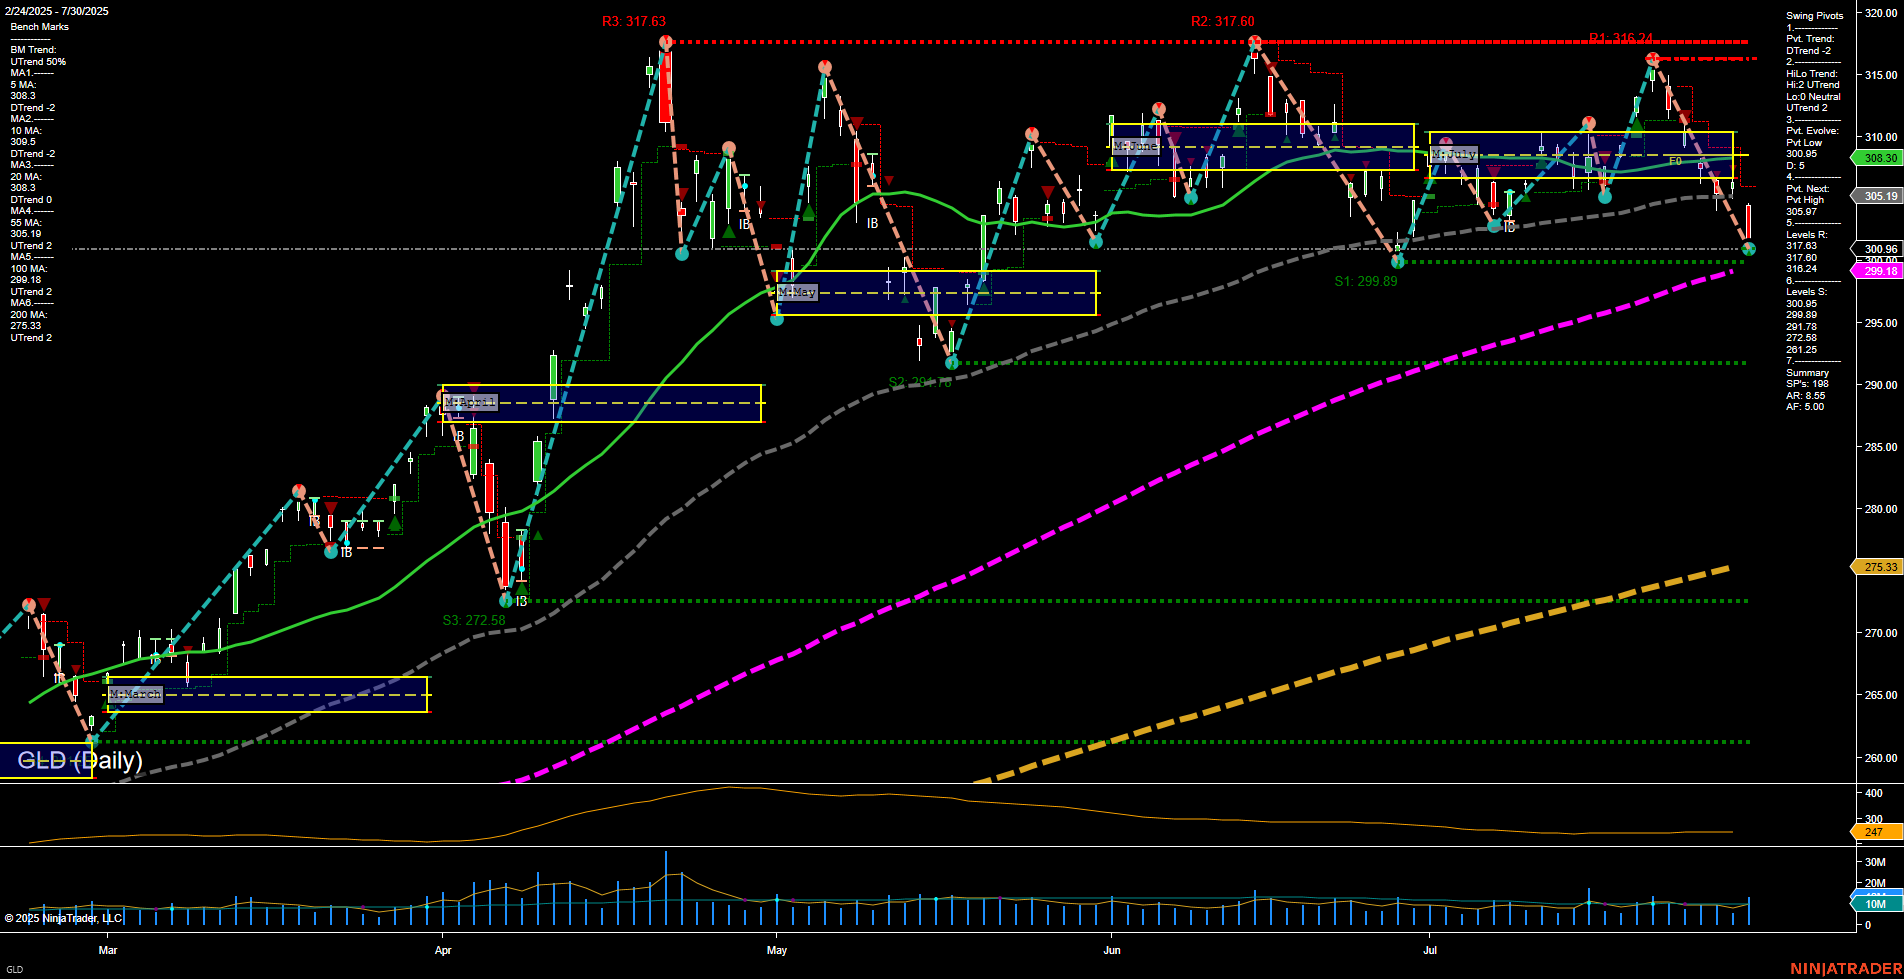
GLD SPDR Gold Shares Daily Chart Analysis: 2025-Jul-31 07:08 CT
Price Action
- Last: 299.18,
- Bars: Medium,
- Mom: Momentum slow.
WSFG Weekly
- Short-Term
- WSFG Current: NA%
- F0%/NTZ' Bias: Price Neutral,
- WSFG Trend: Neutral.
MSFG Month Jul
- Intermediate-Term
- MSFG Current: NA%
- F0%/NTZ' Bias: Price Neutral,
- MSFG Trend: Neutral.
YSFG Year 2025
- Long-Term
- YSFG Current: NA%
- F0%/NTZ' Bias: Price Neutral,
- YSFG Trend: Neutral.
Swing Pivots
- (Short-Term) 1. Pvt. Trend: DTrend,
- (Intermediate-Term) 2. HiLo Trend: UTrend,
- 3. Pvt. Evolve: Pvt High 308.09,
- 4. Pvt. Next: Pvt Low 299.89,
- 5. Levels R: 317.63, 317.60, 316.24, 308.09,
- 6. Levels S: 299.89, 299.08, 272.58, 271.25.
Daily Benchmarks
- (Short-Term) 5 Day: 305.91 Down Trend,
- (Short-Term) 10 Day: 308.3 Down Trend,
- (Intermediate-Term) 20 Day: 309.96 Down Trend,
- (Intermediate-Term) 55 Day: 300.96 Up Trend,
- (Long-Term) 100 Day: 305.43 Up Trend,
- (Long-Term) 200 Day: 275.33 Up Trend.
Additional Metrics
Overall Rating
- Short-Term: Bearish,
- Intermediate-Term: Neutral,
- Long-Term: Bullish.
Key Insights Summary
GLD is currently experiencing a short-term downtrend, as indicated by the recent pivot trend (DTrend) and the downward direction of the 5, 10, and 20-day moving averages. Price has recently broken below the monthly NTZ and is testing support near 299.89, with the next significant support at 299.08. Intermediate-term structure remains neutral, with the HiLo trend still up, suggesting that the broader swing structure has not yet fully reversed. Long-term moving averages (100 and 200-day) remain in uptrends, reflecting underlying bullishness in the larger time frame. Volatility is moderate (ATR 159), and volume is steady. The market is consolidating within a broad range, with resistance clustered around 316–317 and support in the 299–300 zone. The current environment is characterized by choppy, range-bound price action, with no clear breakout or breakdown, and the market is in a corrective phase within a longer-term uptrend.
Chart Analysis ATS AI Generated: 2025-07-31 07:08 for Informational use only, not trading advice. Terms and Risk Disclosure Copyright © 2025. Algo Trading Systems LLC.
