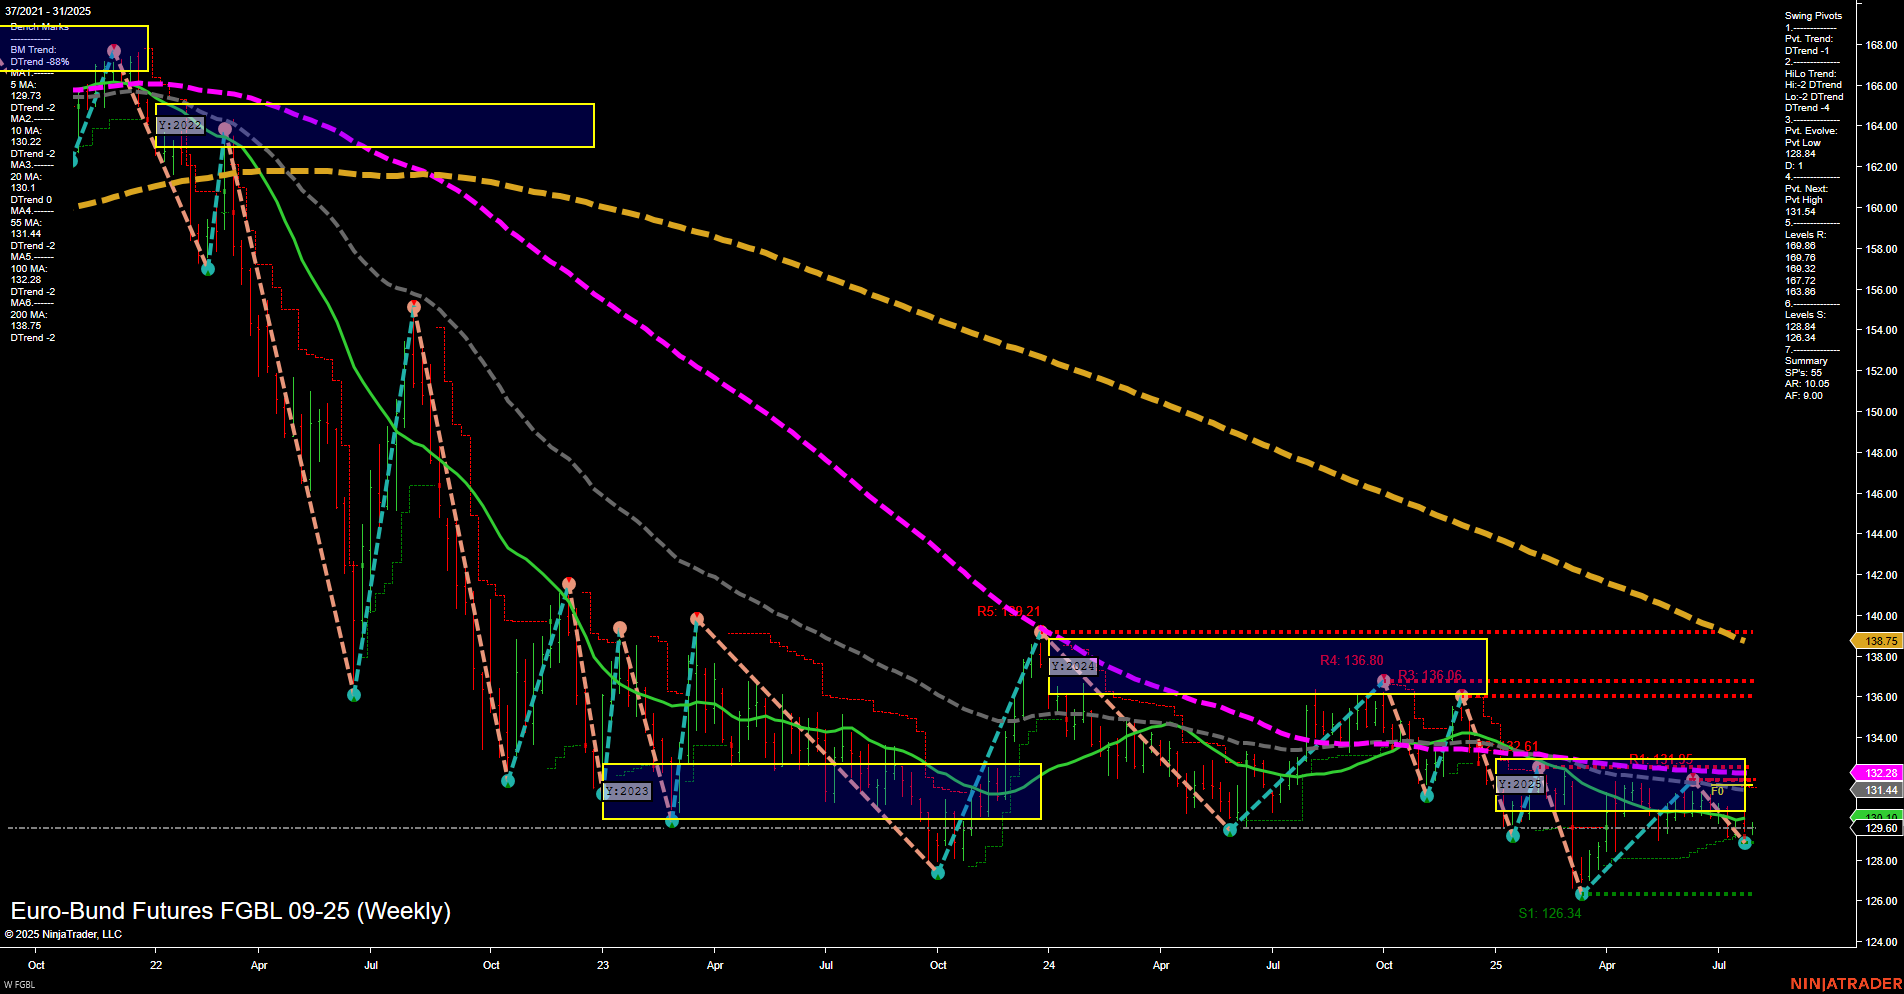
FGBL Euro-Bund Futures Weekly Chart Analysis: 2025-Jul-31 07:07 CT
Price Action
- Last: 129.61,
- Bars: Medium,
- Mom: Momentum slow.
WSFG Weekly
- Short-Term
- WSFG Current: 26%
- F0%/NTZ' Bias: Price Above,
- WSFG Trend: Up.
MSFG Month Jul
- Intermediate-Term
- MSFG Current: -27%
- F0%/NTZ' Bias: Price Below,
- MSFG Trend: Down.
YSFG Year 2025
- Long-Term
- YSFG Current: -17%
- F0%/NTZ' Bias: Price Below,
- YSFG Trend: Down.
Swing Pivots
- (Short-Term) 1. Pvt. Trend: DTrend,
- (Intermediate-Term) 2. HiLo Trend: DTrend,
- 3. Pvt. Evolve: Pvt low 129.61,
- 4. Pvt. Next: Pvt high 131.54,
- 5. Levels R: 136.80, 136.06, 132.28, 131.54,
- 6. Levels S: 129.61, 126.34, 122.84, 72.00.
Weekly Benchmarks
- (Intermediate-Term) 5 Week: 131.44 Down Trend,
- (Intermediate-Term) 10 Week: 132.28 Down Trend,
- (Long-Term) 20 Week: 131.41 Down Trend,
- (Long-Term) 55 Week: 138.75 Down Trend,
- (Long-Term) 100 Week: 143.28 Down Trend,
- (Long-Term) 200 Week: 153.44 Down Trend.
Recent Trade Signals
- 29 Jul 2025: Long FGBL 09-25 @ 129.51 Signals.USAR-WSFG
- 23 Jul 2025: Short FGBL 09-25 @ 129.93 Signals.USAR-MSFG
- 23 Jul 2025: Short FGBL 09-25 @ 129.93 Signals.USAR.TR120
Overall Rating
- Short-Term: Neutral
- Intermediate-Term: Bearish
- Long-Term: Bearish
Key Insights Summary
The FGBL Euro-Bund Futures weekly chart shows a market in a broad, persistent downtrend across intermediate and long-term timeframes, as confirmed by the downward sloping 20, 55, 100, and 200 week moving averages and the negative YSFG and MSFG trends. Short-term action is more mixed: while the WSFG trend is up and the most recent trade signal was a long, the swing pivot trend remains down and price is below most key moving averages, indicating a lack of strong bullish momentum. The current price is near a recent swing low, with the next resistance at 131.54 and major resistance clustered between 132.28 and 136.80. Support is close by at 129.61 and further down at 126.34. The market appears to be in a consolidation phase after a prolonged decline, with slow momentum and medium-sized bars suggesting indecision. Overall, the structure favors a bearish bias for intermediate and long-term horizons, while the short-term outlook is neutral, awaiting a decisive move above resistance or a breakdown below support to confirm the next directional swing.
Chart Analysis ATS AI Generated: 2025-07-31 07:07 for Informational use only, not trading advice. Terms and Risk Disclosure Copyright © 2025. Algo Trading Systems LLC.
