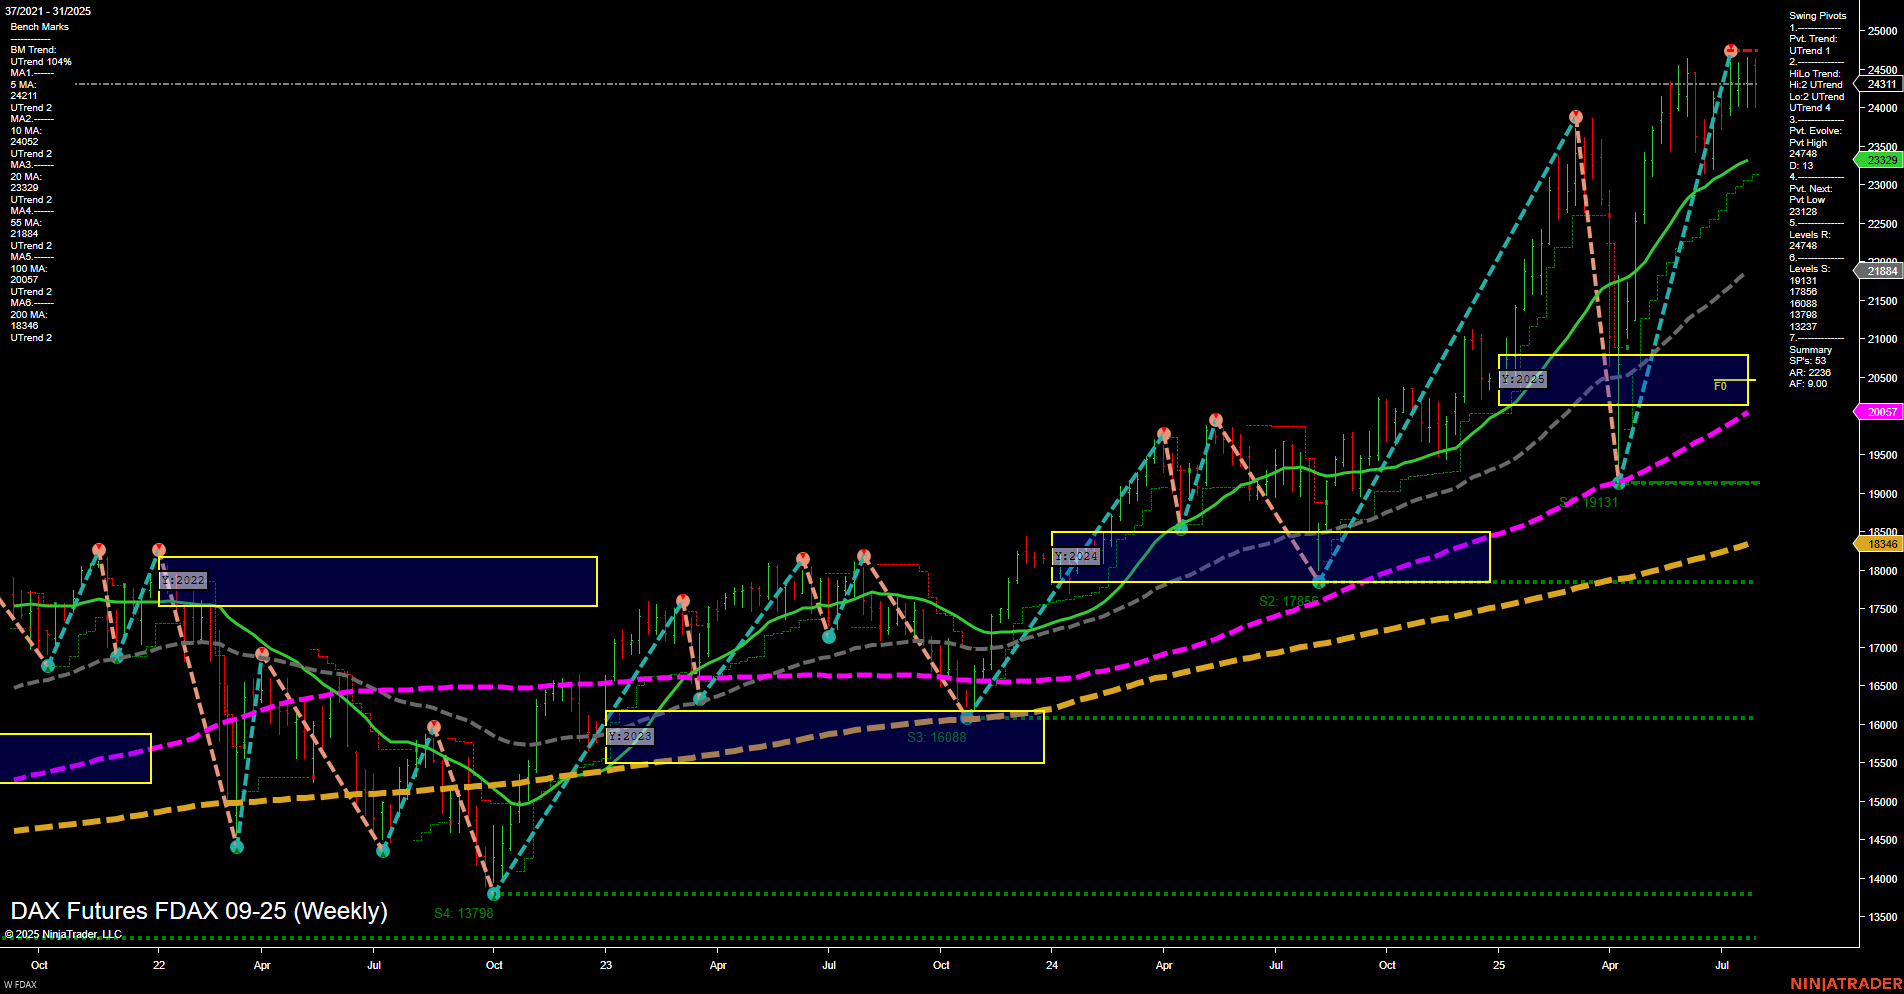
FDAX DAX Futures Weekly Chart Analysis: 2025-Jul-31 07:06 CT
Price Action
- Last: 24,511,
- Bars: Large,
- Mom: Momentum fast.
WSFG Weekly
- Short-Term
- WSFG Current: -41%
- F0%/NTZ' Bias: Price Below,
- WSFG Trend: Down.
MSFG Month Jul
- Intermediate-Term
- MSFG Current: 9%
- F0%/NTZ' Bias: Price Above,
- MSFG Trend: Up.
YSFG Year 2025
- Long-Term
- YSFG Current: 116%
- F0%/NTZ' Bias: Price Above,
- YSFG Trend: Up.
Swing Pivots
- (Short-Term) 1. Pvt. Trend: UTrend,
- (Intermediate-Term) 2. HiLo Trend: UTrend,
- 3. Pvt. Evolve: Pvt high 24,478,
- 4. Pvt. Next: Pvt low 23,128,
- 5. Levels R: 24,650, 24,311, 24,000,
- 6. Levels S: 23,329, 21,884, 19,131, 17,868, 16,088, 13,798.
Weekly Benchmarks
- (Intermediate-Term) 5 Week: 24,211 Up Trend,
- (Intermediate-Term) 10 Week: 24,002 Up Trend,
- (Long-Term) 20 Week: 23,329 Up Trend,
- (Long-Term) 55 Week: 21,884 Up Trend,
- (Long-Term) 100 Week: 20,057 Up Trend,
- (Long-Term) 200 Week: 18,346 Up Trend.
Recent Trade Signals
- 31 Jul 2025: Long FDAX 09-25 @ 24465 Signals.USAR-MSFG
- 29 Jul 2025: Long FDAX 09-25 @ 24328 Signals.USAR.TR120
- 25 Jul 2025: Long FDAX 09-25 @ 24388 Signals.USAR-WSFG
Overall Rating
- Short-Term: Neutral,
- Intermediate-Term: Bullish,
- Long-Term: Bullish.
Key Insights Summary
The FDAX DAX Futures weekly chart shows a strong long-term and intermediate-term uptrend, supported by all major moving averages trending higher and price action well above key benchmarks. The yearly and monthly session fib grids confirm this bullish structure, with price holding above their respective NTZ/F0% levels. However, the short-term WSFG trend is down, and price is currently below the weekly NTZ, indicating some short-term consolidation or a possible pullback after a strong rally. Swing pivots highlight a recent pivot high at 24,478, with the next significant support at 23,329 and further below. Recent trade signals have all been long, aligning with the prevailing intermediate and long-term trends. Overall, the market is in a strong uptrend with short-term consolidation, suggesting a pause or digestion phase within a broader bullish context.
Chart Analysis ATS AI Generated: 2025-07-31 07:07 for Informational use only, not trading advice. Terms and Risk Disclosure Copyright © 2025. Algo Trading Systems LLC.
