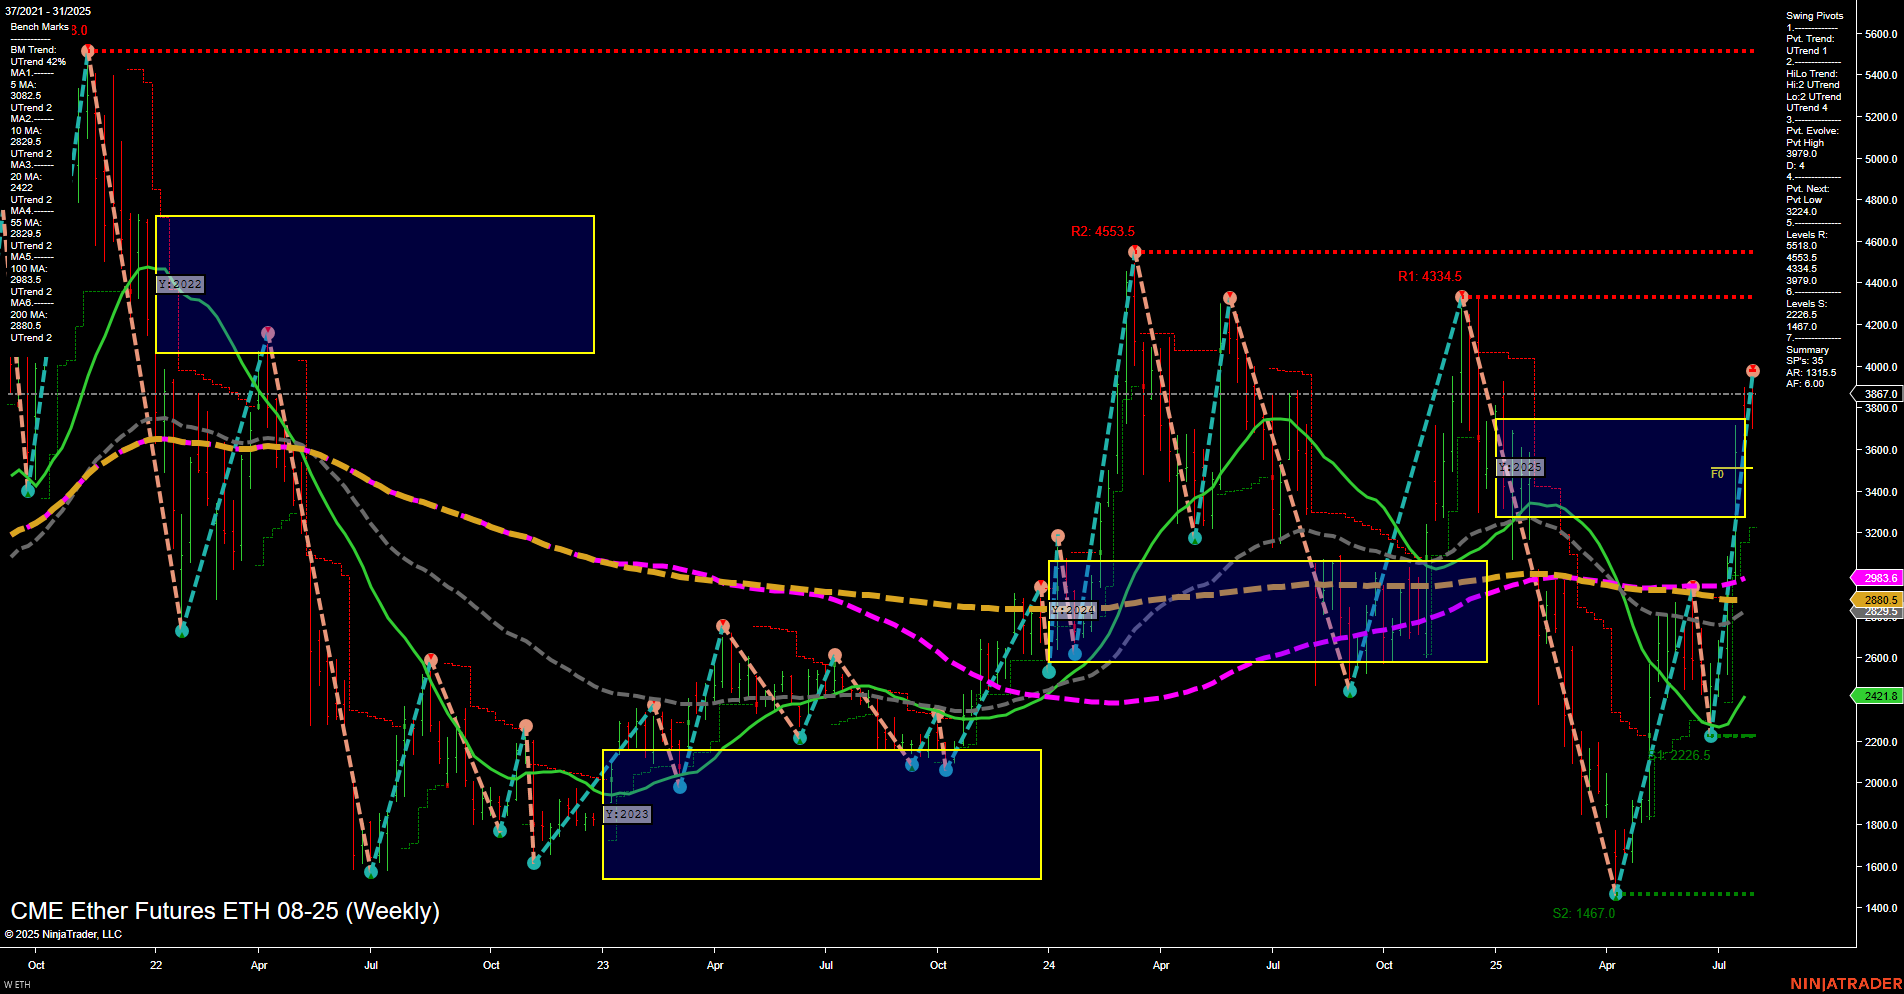
ETH CME Ether Futures Weekly Chart Analysis: 2025-Jul-31 07:06 CT
Price Action
- Last: 3867.0,
- Bars: Large,
- Mom: Momentum fast.
WSFG Weekly
- Short-Term
- WSFG Current: -1%
- F0%/NTZ' Bias: Price Below,
- WSFG Trend: Down.
MSFG Month Jul
- Intermediate-Term
- MSFG Current: 171%
- F0%/NTZ' Bias: Price Above,
- MSFG Trend: Up.
YSFG Year 2025
- Long-Term
- YSFG Current: 15%
- F0%/NTZ' Bias: Price Above,
- YSFG Trend: Up.
Swing Pivots
- (Short-Term) 1. Pvt. Trend: UTrend,
- (Intermediate-Term) 2. HiLo Trend: UTrend,
- 3. Pvt. Evolve: Pvt High 3870.0,
- 4. Pvt. Next: Pvt Low 3226.5,
- 5. Levels R: 4553.5, 4334.5, 3870.0,
- 6. Levels S: 3226.5, 2226.5, 1467.0.
Weekly Benchmarks
- (Intermediate-Term) 5 Week: 3032.5 Up Trend,
- (Intermediate-Term) 10 Week: 2880.5 Up Trend,
- (Long-Term) 20 Week: 2421.8 Up Trend,
- (Long-Term) 55 Week: 2693.5 Up Trend,
- (Long-Term) 100 Week: 2983.6 Up Trend,
- (Long-Term) 200 Week: 2880.5 Up Trend.
Recent Trade Signals
- 30 Jul 2025: Short ETH 08-25 @ 3813.5 Signals.USAR-WSFG
- 28 Jul 2025: Long ETH 08-25 @ 3914.5 Signals.USAR.TR120
Overall Rating
- Short-Term: Neutral,
- Intermediate-Term: Bullish,
- Long-Term: Bullish.
Key Insights Summary
ETH CME Ether Futures have shown a strong and rapid price recovery, with large weekly bars and fast momentum pushing price above key long-term moving averages and the yearly and monthly session fib grid centers. The short-term WSFG trend is down, with price just below the weekly NTZ, suggesting some near-term resistance or consolidation after a sharp rally. However, both intermediate and long-term trends remain firmly bullish, supported by upward trends in all major moving averages and higher swing pivot highs. Resistance levels are clustered above at 3870, 4334, and 4553, while support is well below at 3226 and 2226, indicating a wide trading range. Recent mixed trade signals reflect short-term indecision, but the overall structure favors continuation of the broader uptrend unless a significant reversal develops at these resistance levels. The market is currently in a high-volatility, trend-continuation phase, with potential for further upside if resistance is cleared, but also susceptible to pullbacks given the extended move.
Chart Analysis ATS AI Generated: 2025-07-31 07:06 for Informational use only, not trading advice. Terms and Risk Disclosure Copyright © 2025. Algo Trading Systems LLC.
