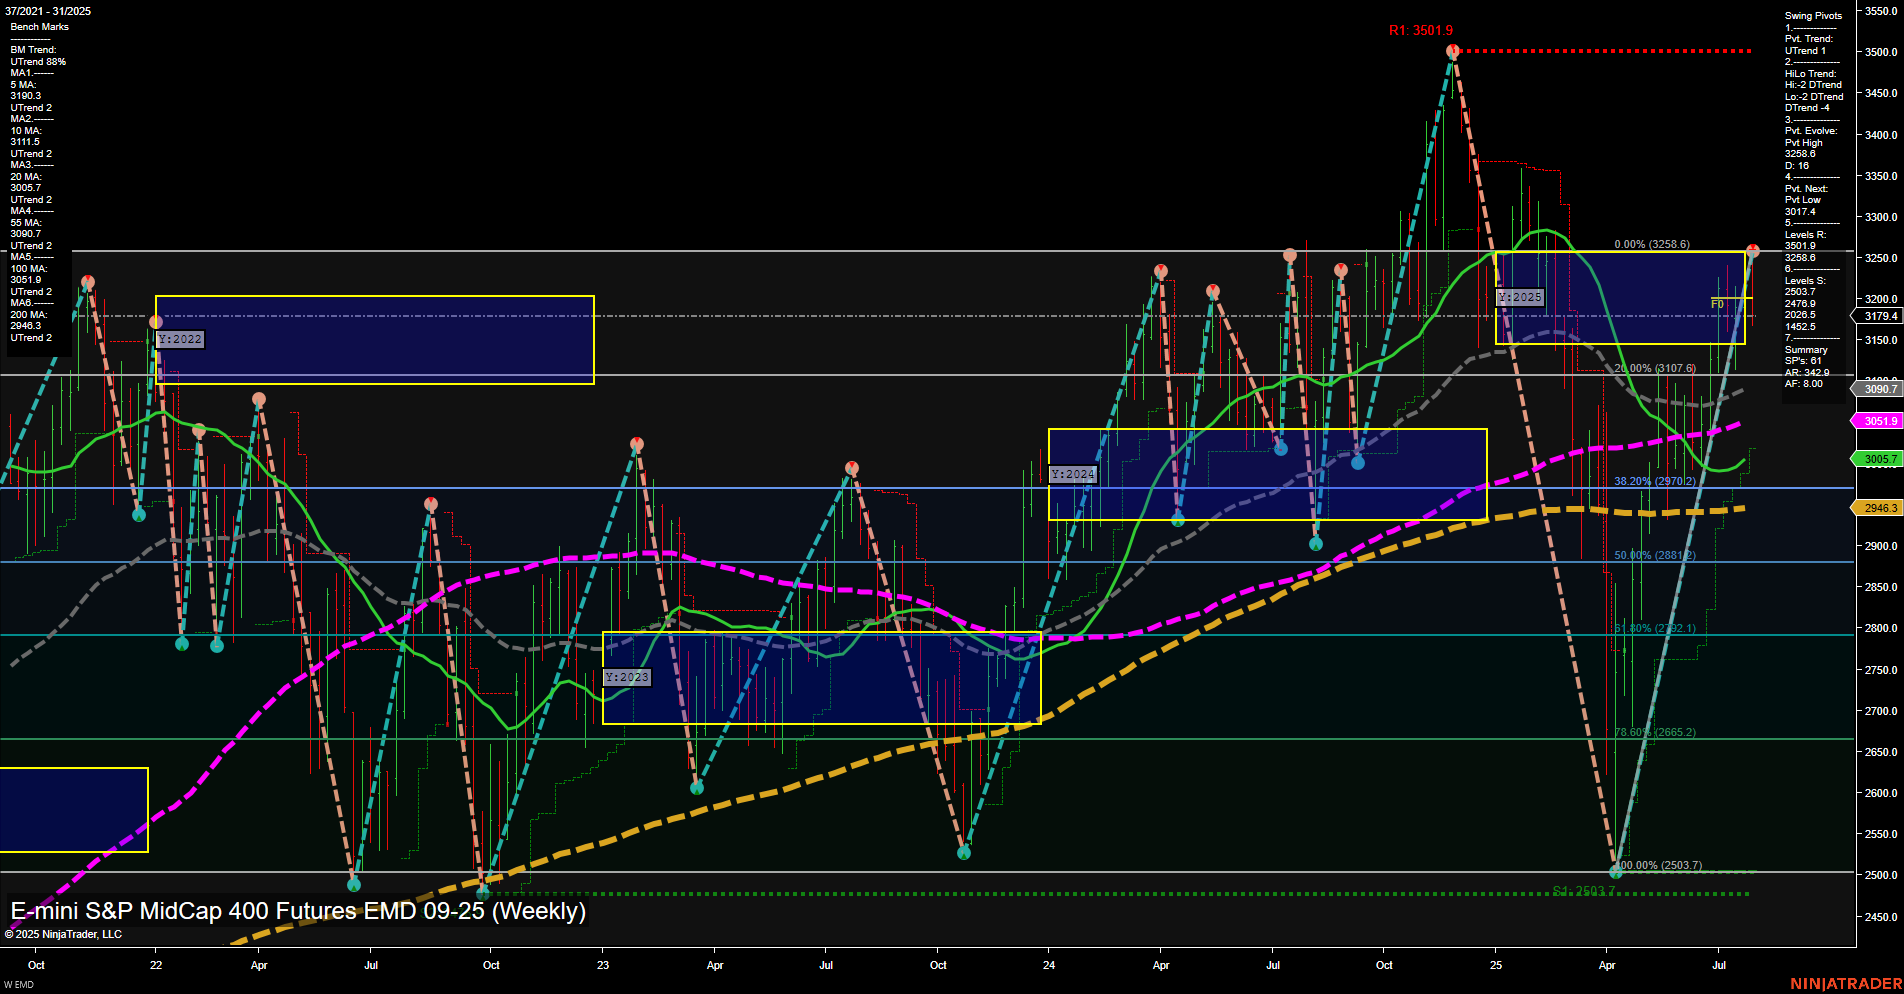
EMD E-mini S&P MidCap 400 Futures Weekly Chart Analysis: 2025-Jul-31 07:05 CT
Price Action
- Last: 3236.9,
- Bars: Medium,
- Mom: Momentum average.
WSFG Weekly
- Short-Term
- WSFG Current: -78%
- F0%/NTZ' Bias: Price Below,
- WSFG Trend: Down.
MSFG Month Jul
- Intermediate-Term
- MSFG Current: 18%
- F0%/NTZ' Bias: Price Above,
- MSFG Trend: Up.
YSFG Year 2025
- Long-Term
- YSFG Current: -4%
- F0%/NTZ' Bias: Price Below,
- YSFG Trend: Down.
Swing Pivots
- (Short-Term) 1. Pvt. Trend: UTrend,
- (Intermediate-Term) 2. HiLo Trend: DTrend,
- 3. Pvt. Evolve: Pvt high 3236.9,
- 4. Pvt. Next: Pvt low 3177.9,
- 5. Levels R: 3501.9, 3236.9,
- 6. Levels S: 3177.9, 3107.6, 2970.2, 2881.7, 2665.2, 2503.7.
Weekly Benchmarks
- (Intermediate-Term) 5 Week: 3111.5 Up Trend,
- (Intermediate-Term) 10 Week: 3124.2 Up Trend,
- (Long-Term) 20 Week: 3177.9 Up Trend,
- (Long-Term) 55 Week: 3051.9 Up Trend,
- (Long-Term) 100 Week: 3005.7 Up Trend,
- (Long-Term) 200 Week: 2946.3 Up Trend.
Recent Trade Signals
- 30 Jul 2025: Short EMD 09-25 @ 3231.4 Signals.USAR-WSFG
- 25 Jul 2025: Long EMD 09-25 @ 3232.2 Signals.USAR.TR120
Overall Rating
- Short-Term: Neutral,
- Intermediate-Term: Bearish,
- Long-Term: Neutral.
Key Insights Summary
The EMD futures weekly chart shows a market in transition, with mixed signals across timeframes. Price action is currently at 3236.9, with medium-sized bars and average momentum, indicating neither strong buying nor selling pressure. The short-term WSFG trend is down, with price below the NTZ, but the swing pivot trend is up, suggesting a possible short-term bounce or retracement within a broader downtrend. Intermediate-term signals are conflicted: the MSFG trend is up, but the HiLo swing trend is down, and recent trade signals have flipped between long and short, reflecting choppy, indecisive price action. Long-term, the YSFG trend is down, but all major moving averages (20, 55, 100, 200 week) are in uptrends, showing underlying support and a possible base-building phase. Key resistance is at 3501.9 and 3236.9, with support levels layered below at 3177.9 and 3107.6. The market appears to be consolidating after a strong rally, with potential for further sideways movement or a test of lower support if sellers regain control. Overall, the environment is characterized by volatility and a lack of clear directional conviction, with both trend continuation and reversal scenarios possible in the coming weeks.
Chart Analysis ATS AI Generated: 2025-07-31 07:05 for Informational use only, not trading advice. Terms and Risk Disclosure Copyright © 2025. Algo Trading Systems LLC.
