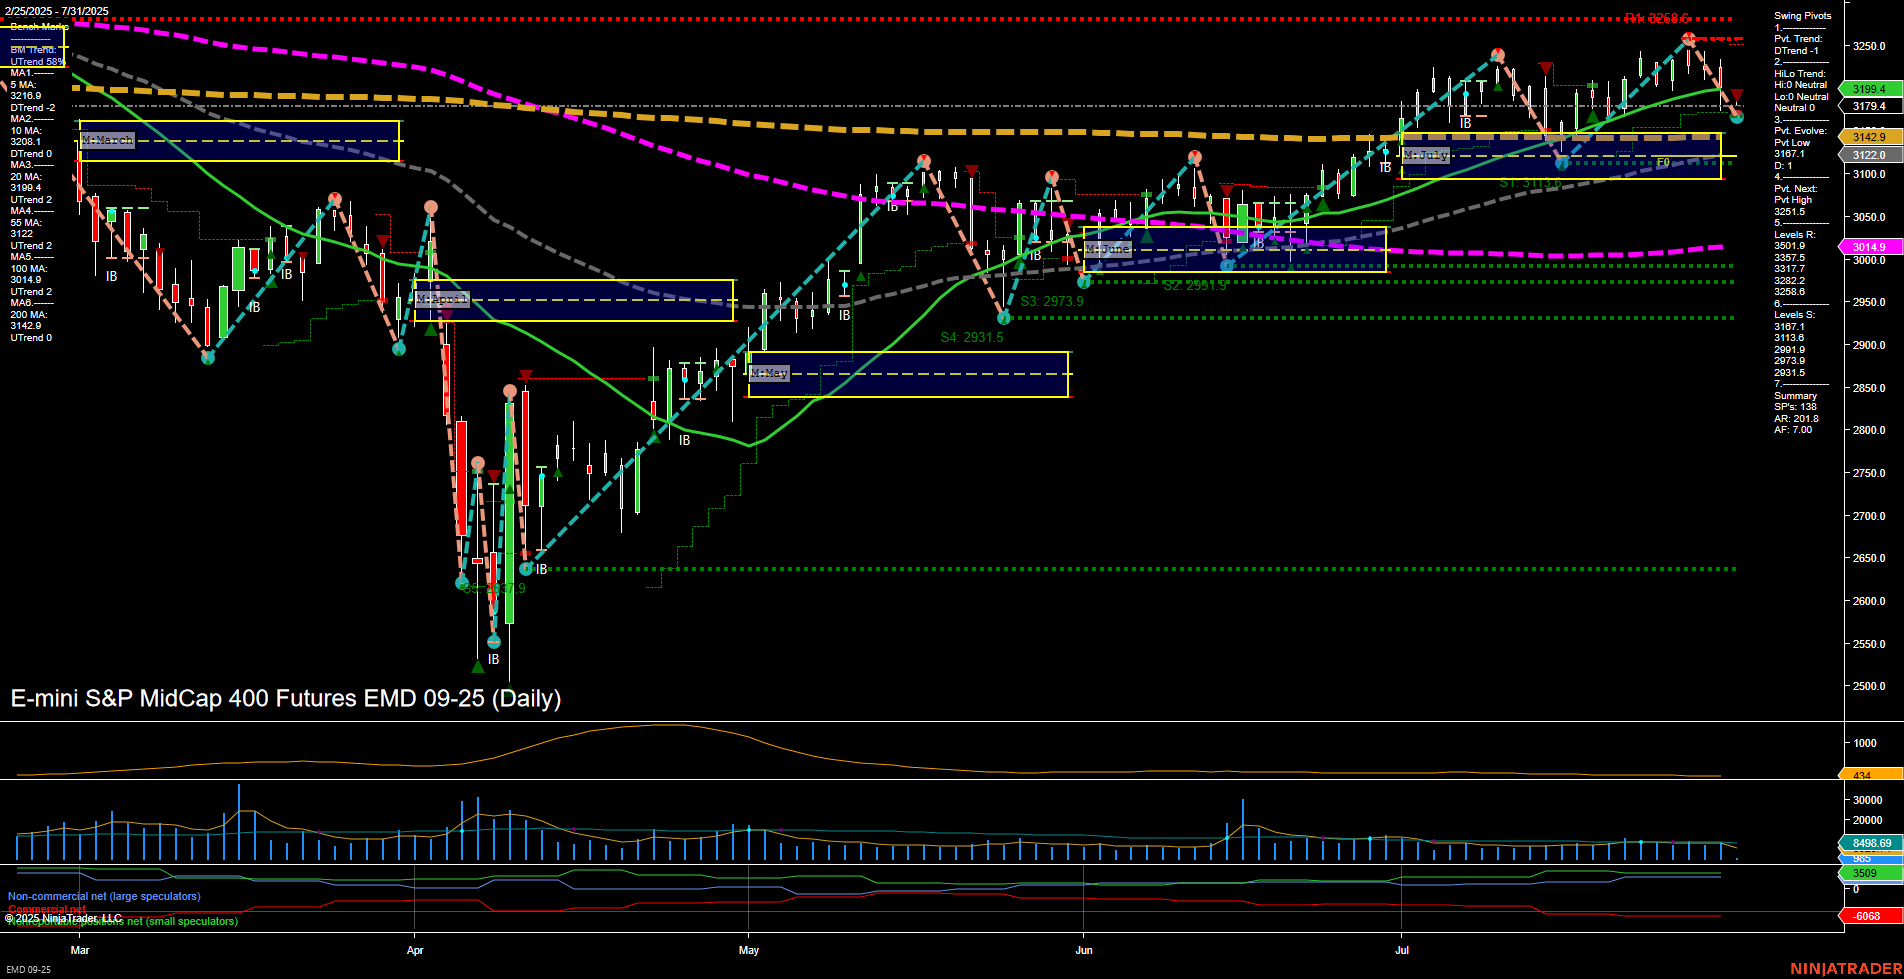
EMD E-mini S&P MidCap 400 Futures Daily Chart Analysis: 2025-Jul-31 07:04 CT
Price Action
- Last: 3199.4,
- Bars: Medium,
- Mom: Average.
WSFG Weekly
- Short-Term
- WSFG Current: -78%
- F0%/NTZ' Bias: Price Below,
- WSFG Trend: Down.
MSFG Month Jul
- Intermediate-Term
- MSFG Current: 18%
- F0%/NTZ' Bias: Price Above,
- MSFG Trend: Up.
YSFG Year 2025
- Long-Term
- YSFG Current: -4%
- F0%/NTZ' Bias: Price Below,
- YSFG Trend: Down.
Swing Pivots
- (Short-Term) 1. Pvt. Trend: DTrend,
- (Intermediate-Term) 2. HiLo Trend: Neutral,
- 3. Pvt. Evolve: Pvt High 3256.6,
- 4. Pvt. Next: Pvt Low 3122.0,
- 5. Levels R: 3256.6, 3237.5, 3222.2, 3199.4,
- 6. Levels S: 3142.9, 3122.0, 3111.8, 2991.9, 2973.9, 2931.5.
Daily Benchmarks
- (Short-Term) 5 Day: 3210.6 Down Trend,
- (Short-Term) 10 Day: 3194.4 Down Trend,
- (Intermediate-Term) 20 Day: 3199.4 Down Trend,
- (Intermediate-Term) 55 Day: 3179.4 Up Trend,
- (Long-Term) 100 Day: 3142.9 Up Trend,
- (Long-Term) 200 Day: 3014.9 Up Trend.
Additional Metrics
Recent Trade Signals
- 30 Jul 2025: Short EMD 09-25 @ 3231.4 Signals.USAR-WSFG
- 25 Jul 2025: Long EMD 09-25 @ 3232.2 Signals.USAR.TR120
Overall Rating
- Short-Term: Bearish,
- Intermediate-Term: Neutral,
- Long-Term: Bullish.
Key Insights Summary
The EMD futures daily chart shows a recent shift in short-term momentum to the downside, with the price now below key weekly and yearly session fib grid levels, and a DTrend in the short-term swing pivot. The last two trade signals reflect this choppy environment, with a quick reversal from long to short in late July. Intermediate-term structure remains neutral, as the monthly fib grid trend is still up and price is above the monthly NTZ, but the swing pivot trend is not confirming a strong uptrend. Long-term moving averages and the 200-day benchmark continue to trend higher, supporting a bullish backdrop, but the current pullback is testing support levels around 3142.9 and 3122.0. Volatility (ATR) is elevated, and volume remains steady, suggesting active participation. The market is in a corrective phase within a broader uptrend, with short-term pressure and potential for further testing of support before any resumption of the longer-term bullish trend.
Chart Analysis ATS AI Generated: 2025-07-31 07:05 for Informational use only, not trading advice. Terms and Risk Disclosure Copyright © 2025. Algo Trading Systems LLC.
