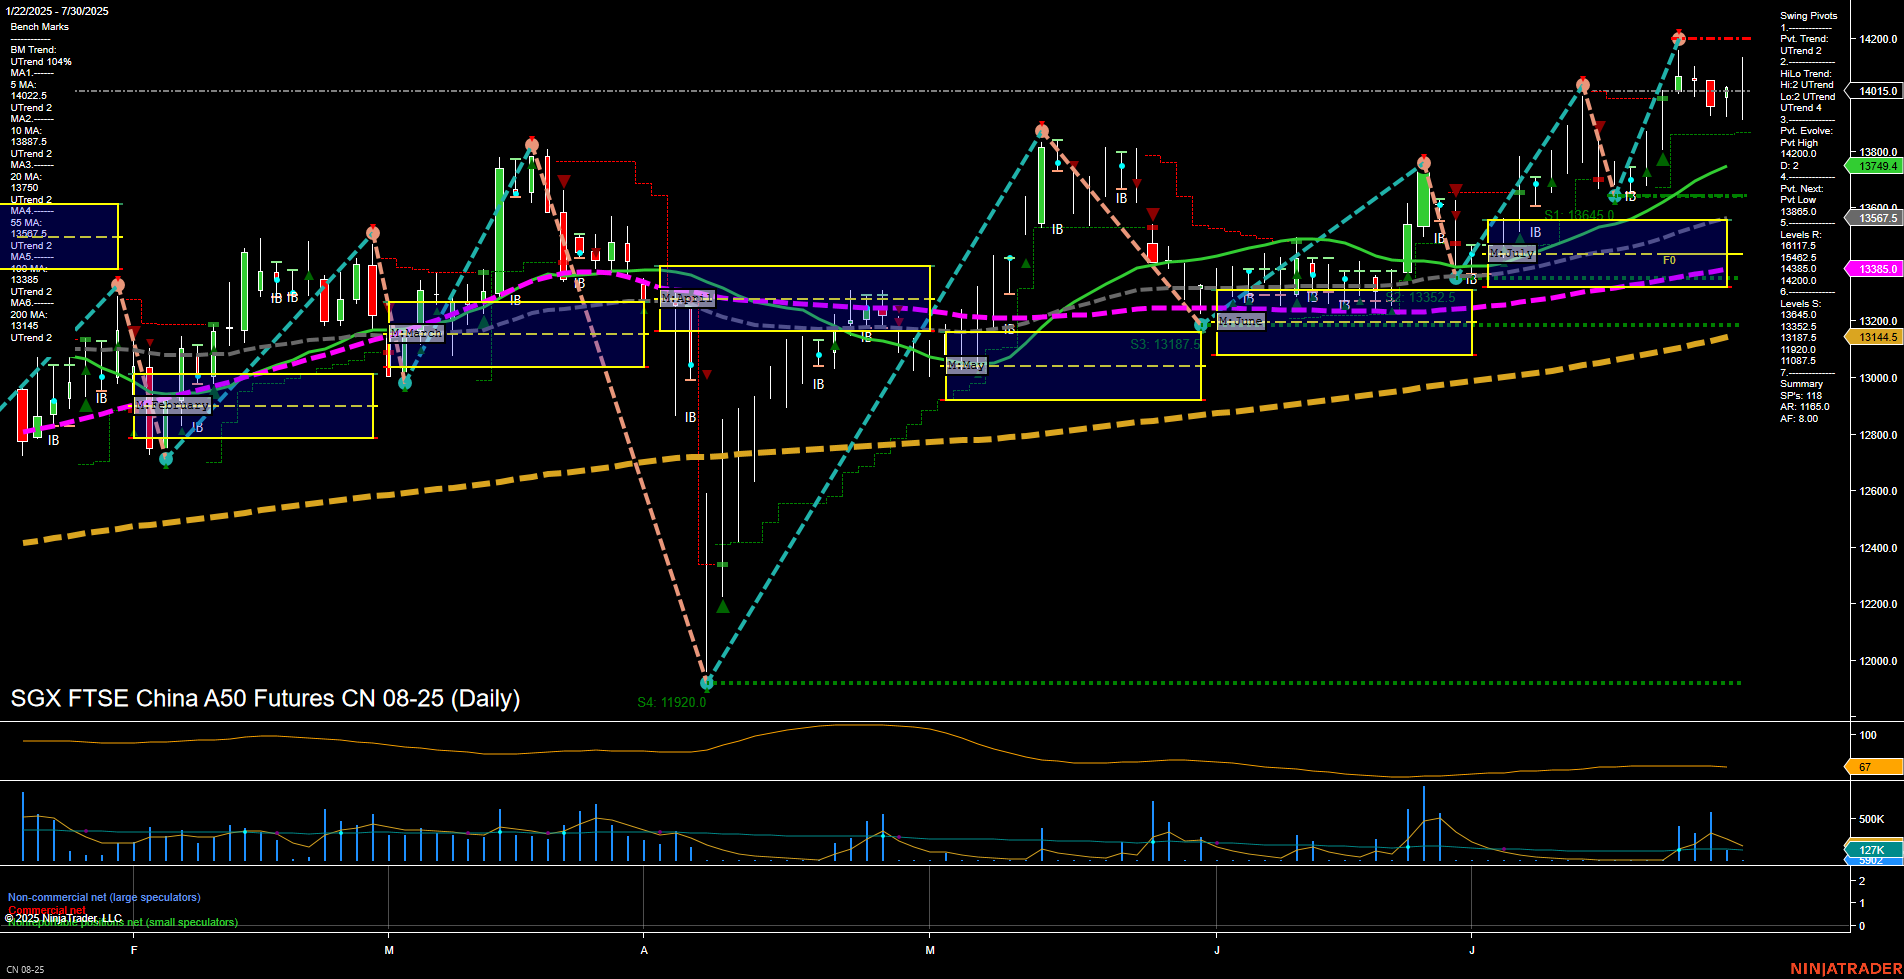
CN SGX FTSE China A50 Futures Daily Chart Analysis: 2025-Jul-31 07:04 CT
Price Action
- Last: 14015.0,
- Bars: Medium,
- Mom: Momentum average.
WSFG Weekly
- Short-Term
- WSFG Current: NA%
- F0%/NTZ' Bias: Price Neutral,
- WSFG Trend: Neutral.
MSFG Month Jul
- Intermediate-Term
- MSFG Current: NA%
- F0%/NTZ' Bias: Price Neutral,
- MSFG Trend: Neutral.
YSFG Year 2025
- Long-Term
- YSFG Current: NA%
- F0%/NTZ' Bias: Price Neutral,
- YSFG Trend: Neutral.
Swing Pivots
- (Short-Term) 1. Pvt. Trend: UTrend,
- (Intermediate-Term) 2. HiLo Trend: UTrend,
- 3. Pvt. Evolve: Pvt High 14200,
- 4. Pvt. Next: Pvt Low 13865.0,
- 5. Levels R: 14200, 14015.0, 13880.0,
- 6. Levels S: 13749.4, 13385.0, 13187.5, 13144.5, 11920.0.
Daily Benchmarks
- (Short-Term) 5 Day: 14022.5 Up Trend,
- (Short-Term) 10 Day: 13887.5 Up Trend,
- (Intermediate-Term) 20 Day: 13749.4 Up Trend,
- (Intermediate-Term) 55 Day: 13385.0 Up Trend,
- (Long-Term) 100 Day: 13336.5 Up Trend,
- (Long-Term) 200 Day: 13144.5 Up Trend.
Additional Metrics
- ATR: 87.5,
- VOLMA: 261842.
Overall Rating
- Short-Term: Bullish,
- Intermediate-Term: Bullish,
- Long-Term: Bullish.
Key Insights Summary
The CN SGX FTSE China A50 Futures daily chart shows a strong bullish structure across all timeframes. Price is currently near recent highs, with the last close at 14015.0 and momentum holding at an average pace. All benchmark moving averages (from 5-day to 200-day) are trending upward, confirming broad-based strength. The swing pivot structure is in an uptrend, with the most recent pivot high at 14200 and the next potential pivot low at 13865.0, suggesting the market is in a higher-high, higher-low sequence. Resistance is layered above at 14200 and 14015.0, while support is well-defined below at 13749.4 and 13385.0. ATR and volume metrics indicate moderate volatility and healthy participation. The overall environment is constructive for trend continuation, with no immediate signs of reversal or exhaustion. The market appears to be consolidating gains after a strong rally, with potential for further upside if resistance levels are cleared.
Chart Analysis ATS AI Generated: 2025-07-31 07:04 for Informational use only, not trading advice. Terms and Risk Disclosure Copyright © 2025. Algo Trading Systems LLC.
