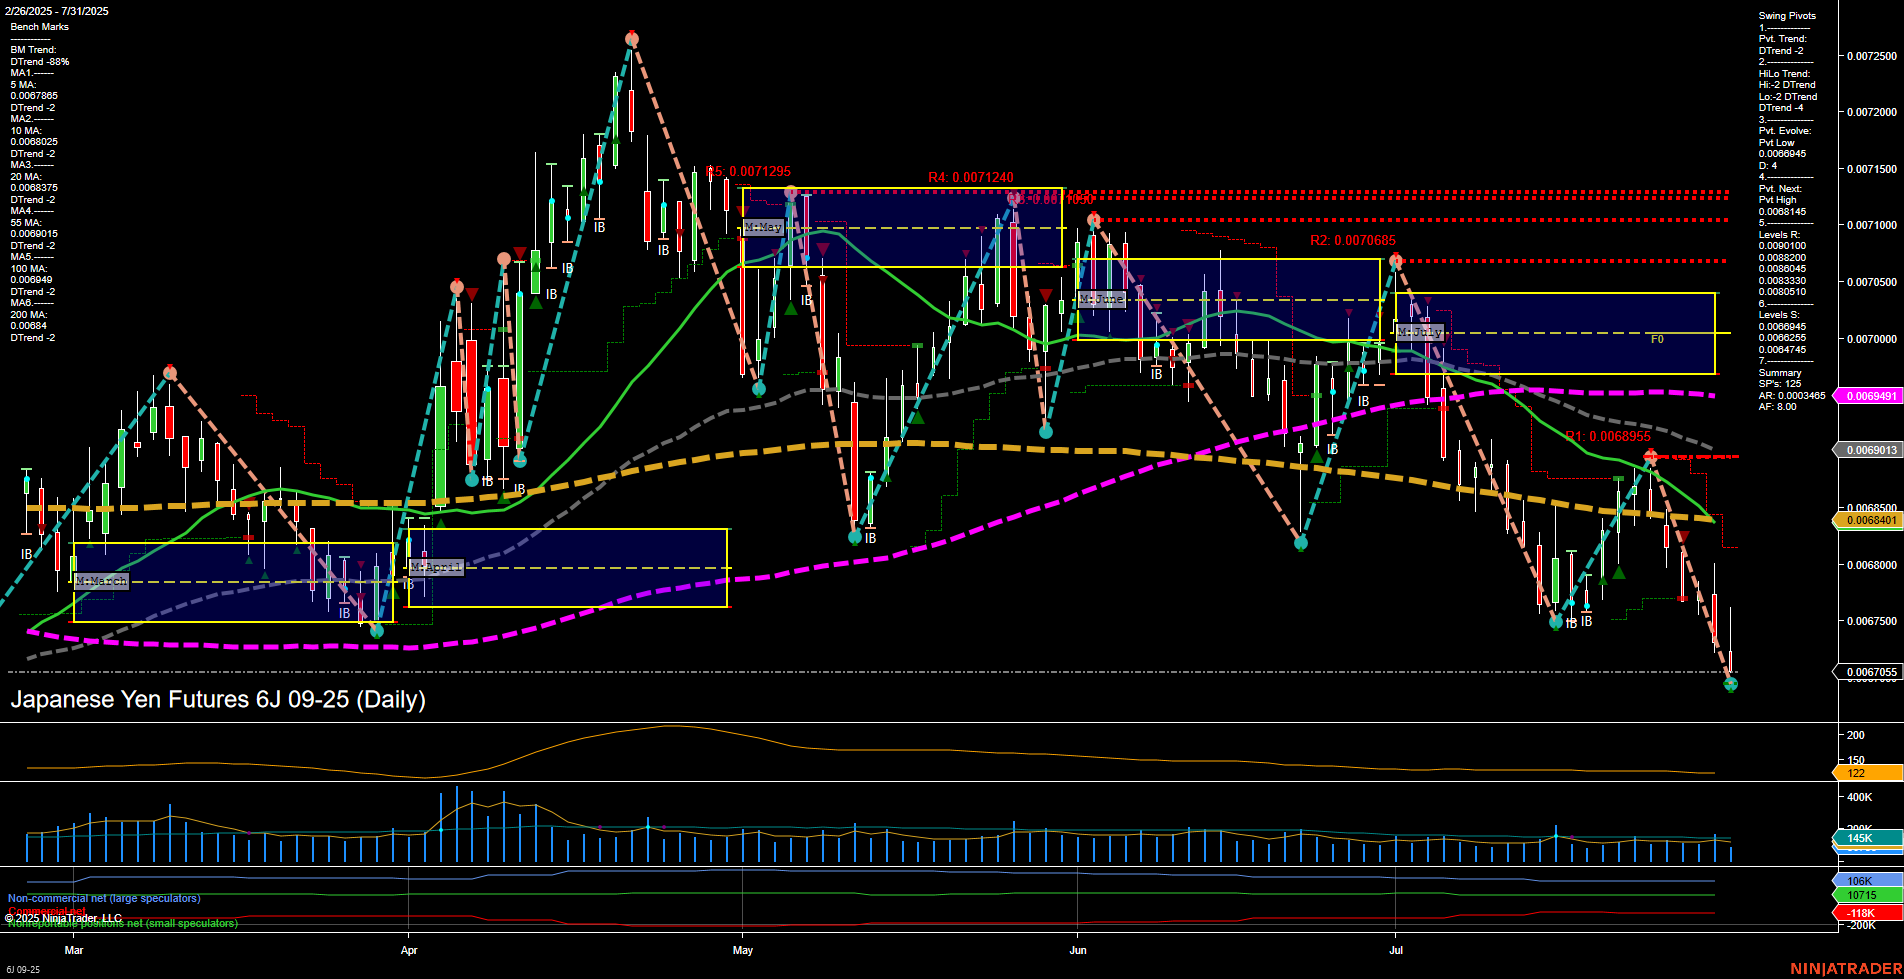
6J Japanese Yen Futures Daily Chart Analysis: 2025-Jul-31 07:02 CT
Price Action
- Last: 0.0067055,
- Bars: Medium,
- Mom: Momentum slow.
WSFG Weekly
- Short-Term
- WSFG Current: -81%
- F0%/NTZ' Bias: Price Below,
- WSFG Trend: Down.
MSFG Month Jul
- Intermediate-Term
- MSFG Current: -84%
- F0%/NTZ' Bias: Price Below,
- MSFG Trend: Down.
YSFG Year 2025
- Long-Term
- YSFG Current: 14%
- F0%/NTZ' Bias: Price Above,
- YSFG Trend: Up.
Swing Pivots
- (Short-Term) 1. Pvt. Trend: DTrend,
- (Intermediate-Term) 2. HiLo Trend: DTrend,
- 3. Pvt. Evolve: Pvt low 0.0067045,
- 4. Pvt. Next: Pvt high 0.0068145,
- 5. Levels R: 0.0072500, 0.0072000, 0.0071500, 0.0071240, 0.0071295, 0.0070685, 0.0070510, 0.0070333, 0.0070000, 0.0068955,
- 6. Levels S: 0.0067045, 0.0067445, 0.0068245.
Daily Benchmarks
- (Short-Term) 5 Day: 0.0067885 Down Trend,
- (Short-Term) 10 Day: 0.0068025 Down Trend,
- (Intermediate-Term) 20 Day: 0.0068375 Down Trend,
- (Intermediate-Term) 55 Day: 0.0069405 Down Trend,
- (Long-Term) 100 Day: 0.0069491 Down Trend,
- (Long-Term) 200 Day: 0.0068401 Down Trend.
Additional Metrics
Recent Trade Signals
- 30 Jul 2025: Short 6J 09-25 @ 0.006743 Signals.USAR.TR720
- 28 Jul 2025: Short 6J 09-25 @ 0.006793 Signals.USAR-WSFG
- 25 Jul 2025: Short 6J 09-25 @ 0.006824 Signals.USAR.TR120
Overall Rating
- Short-Term: Bearish,
- Intermediate-Term: Bearish,
- Long-Term: Neutral.
Key Insights Summary
The Japanese Yen futures (6J) are exhibiting a clear bearish structure in both the short- and intermediate-term timeframes, as evidenced by the persistent downtrend in swing pivots, all major moving averages, and the position of price well below both the weekly and monthly session fib grid NTZs. The most recent price action shows slow momentum and medium-sized bars, indicating a steady but not aggressive selloff. Multiple short signals have been triggered in the past week, reinforcing the prevailing downside bias. However, the long-term yearly fib grid remains in an uptrend, suggesting that the broader macro context is still constructive, but currently overshadowed by the dominant short-term weakness. Volatility (ATR) and volume (VOLMA) are moderate, with no signs of panic or capitulation. Key support is now at 0.0067045, with resistance levels stacked above, indicating that any rallies may face significant overhead supply. The market is in a clear downtrend phase, with no immediate signs of reversal, but the long-term uptrend warrants monitoring for potential basing or reversal patterns in the coming weeks.
Chart Analysis ATS AI Generated: 2025-07-31 07:02 for Informational use only, not trading advice. Terms and Risk Disclosure Copyright © 2025. Algo Trading Systems LLC.
