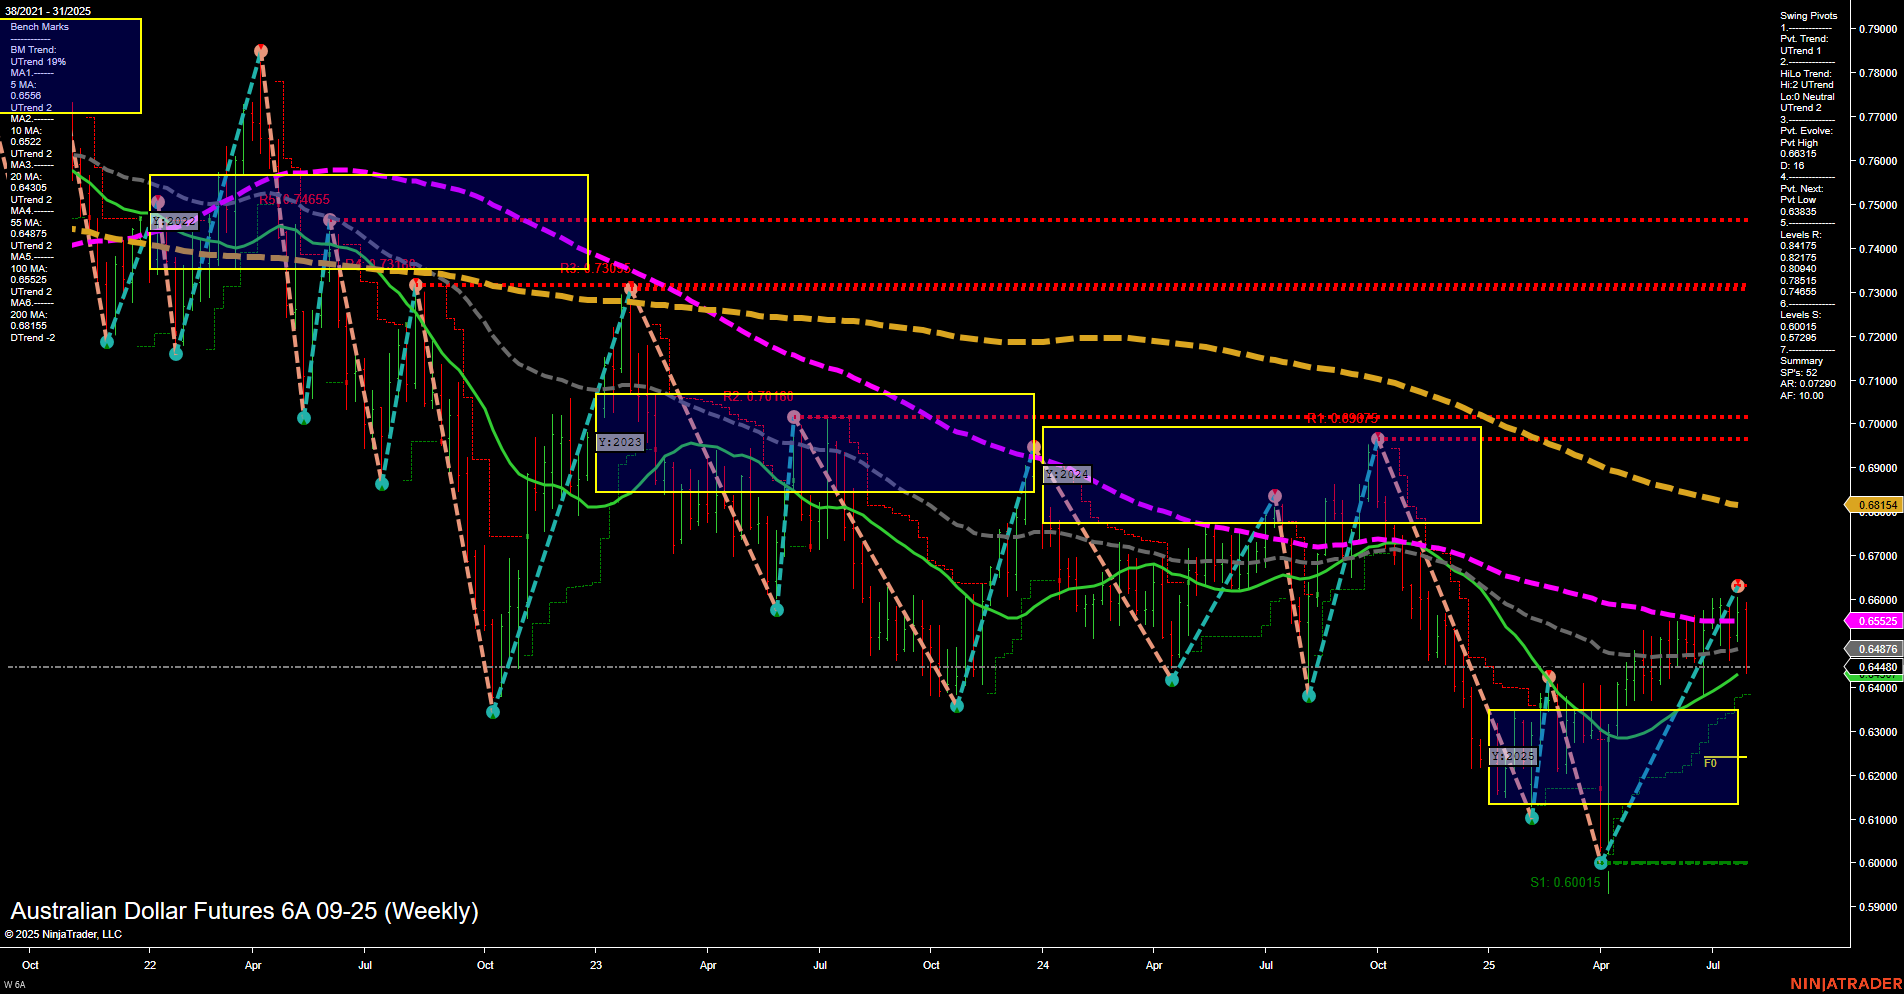
The 6A Australian Dollar Futures weekly chart shows a market in transition. Price action has recently rebounded from a significant swing low (0.60015), with medium-sized bars and average momentum, indicating a moderate recovery but not a strong trend. The short-term swing pivot trend is up, but the intermediate-term HiLo trend remains down, reflecting a broader bearish structure despite the recent bounce. All major session Fib Grids (weekly, monthly, yearly) are neutral, suggesting a lack of clear directional conviction across timeframes. The price is currently testing resistance levels near 0.64515–0.65085, with multiple overhead resistance bands up to 0.68154. Support is clustered below at 0.64486, 0.63835, and the major swing low at 0.60015. Benchmark moving averages show short-term and intermediate-term uptrends (5, 10, 20 week MAs), but the longer-term averages (55, 100, 200 week) remain in downtrends, highlighting a potential countertrend rally within a larger bearish cycle. The most recent trade signal is a short entry, aligning with the prevailing long-term downtrend. Overall, the chart reflects a market in consolidation or corrective phase, with short-term upward momentum facing strong resistance from longer-term bearish forces. The price is at a critical juncture, with the potential for either a continuation of the countertrend rally or a resumption of the dominant downtrend if resistance holds.