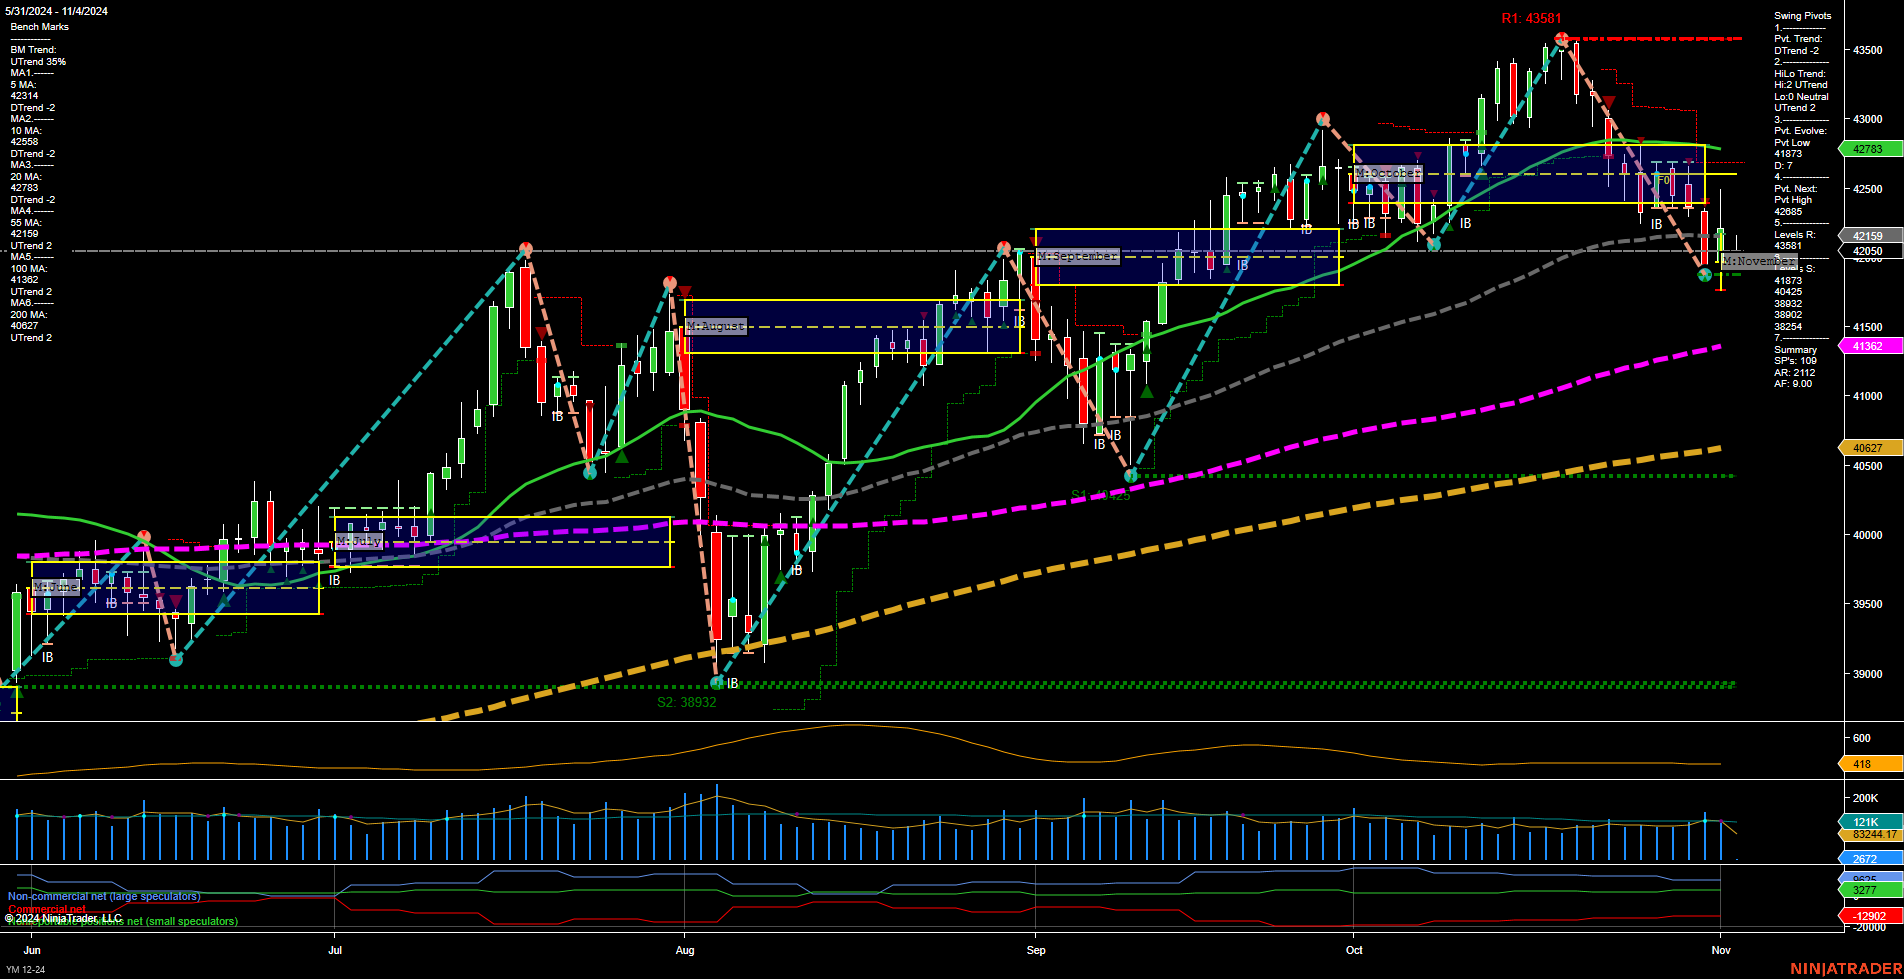
YM E-mini Dow ($5) Futures Daily Chart Analysis: 2024-Nov-03 18:10 CT
Price Action
- Last: 42159,
- Bars: Medium,
- Mom: Momentum average.
WSFG Weekly
- Short-Term
- WSFG Current: -8%
- F0%/NTZ' Bias: Price Below,
- WSFG Trend: Down.
MSFG Month Nov
- Intermediate-Term
- MSFG Current: 4%
- F0%/NTZ' Bias: Price Above,
- MSFG Trend: Up.
- MSFG vs Prior MSFG: Open higher,
Swing Pivots
- (Short-Term) 1. Pvt. Trend: DTrend,
- (Intermediate-Term) 2. HiLo Trend: UTrend,
- 3. Pvt. Evolve: Pvt low 40789,
- 4. Pvt. Next: Pvt high 43581,
- 5. Levels R: 43581,
- 6. Levels S: 40789, 38932.
Daily Benchmarks
- (Short-Term) 5 Day: 42314 Down Trend,
- (Short-Term) 10 Day: 42586 Down Trend,
- (Intermediate-Term) 20 Day: 42783 Down Trend,
- (Intermediate-Term) 55 Day: 42658 Down Trend,
- (Long-Term) 100 Day: 41362 Up Trend,
- (Long-Term) 200 Day: 40627 Up Trend.
Additional Metrics
Recent Trade Signals
- 01 Nov 2024: Long YM 12-24 @ 42364 Signals.USAR.TR120
- 01 Nov 2024: Long YM 12-24 @ 42364 Signals.USAR-MSFG
- 31 Oct 2024: Short YM 12-24 @ 42205 Signals.USAR-WSFG
Overall Rating
- Short-Term: Bearish,
- Intermediate-Term: Neutral,
- Long-Term: Bullish.
Key Insights Summary
The YM E-mini Dow futures are experiencing a mixed trend environment. Short-term indicators suggest a bearish outlook with recent price action below key moving averages and a downward WSFG trend. Intermediate-term signals are neutral, with the MSFG showing an upward trend but recent price action indicating potential consolidation. Long-term trends remain bullish, supported by the 100 and 200-day moving averages. Recent trade signals reflect this mixed sentiment, with both long and short positions being triggered. The market may be in a phase of consolidation, with potential for volatility as it tests support and resistance levels.
Chart Analysis ATS AI Generated: 2024-11-03 18:11 for Informational use only, not trading advice. Terms and Risk Disclosure Copyright © 2024. Algo Trading Systems LLC.
