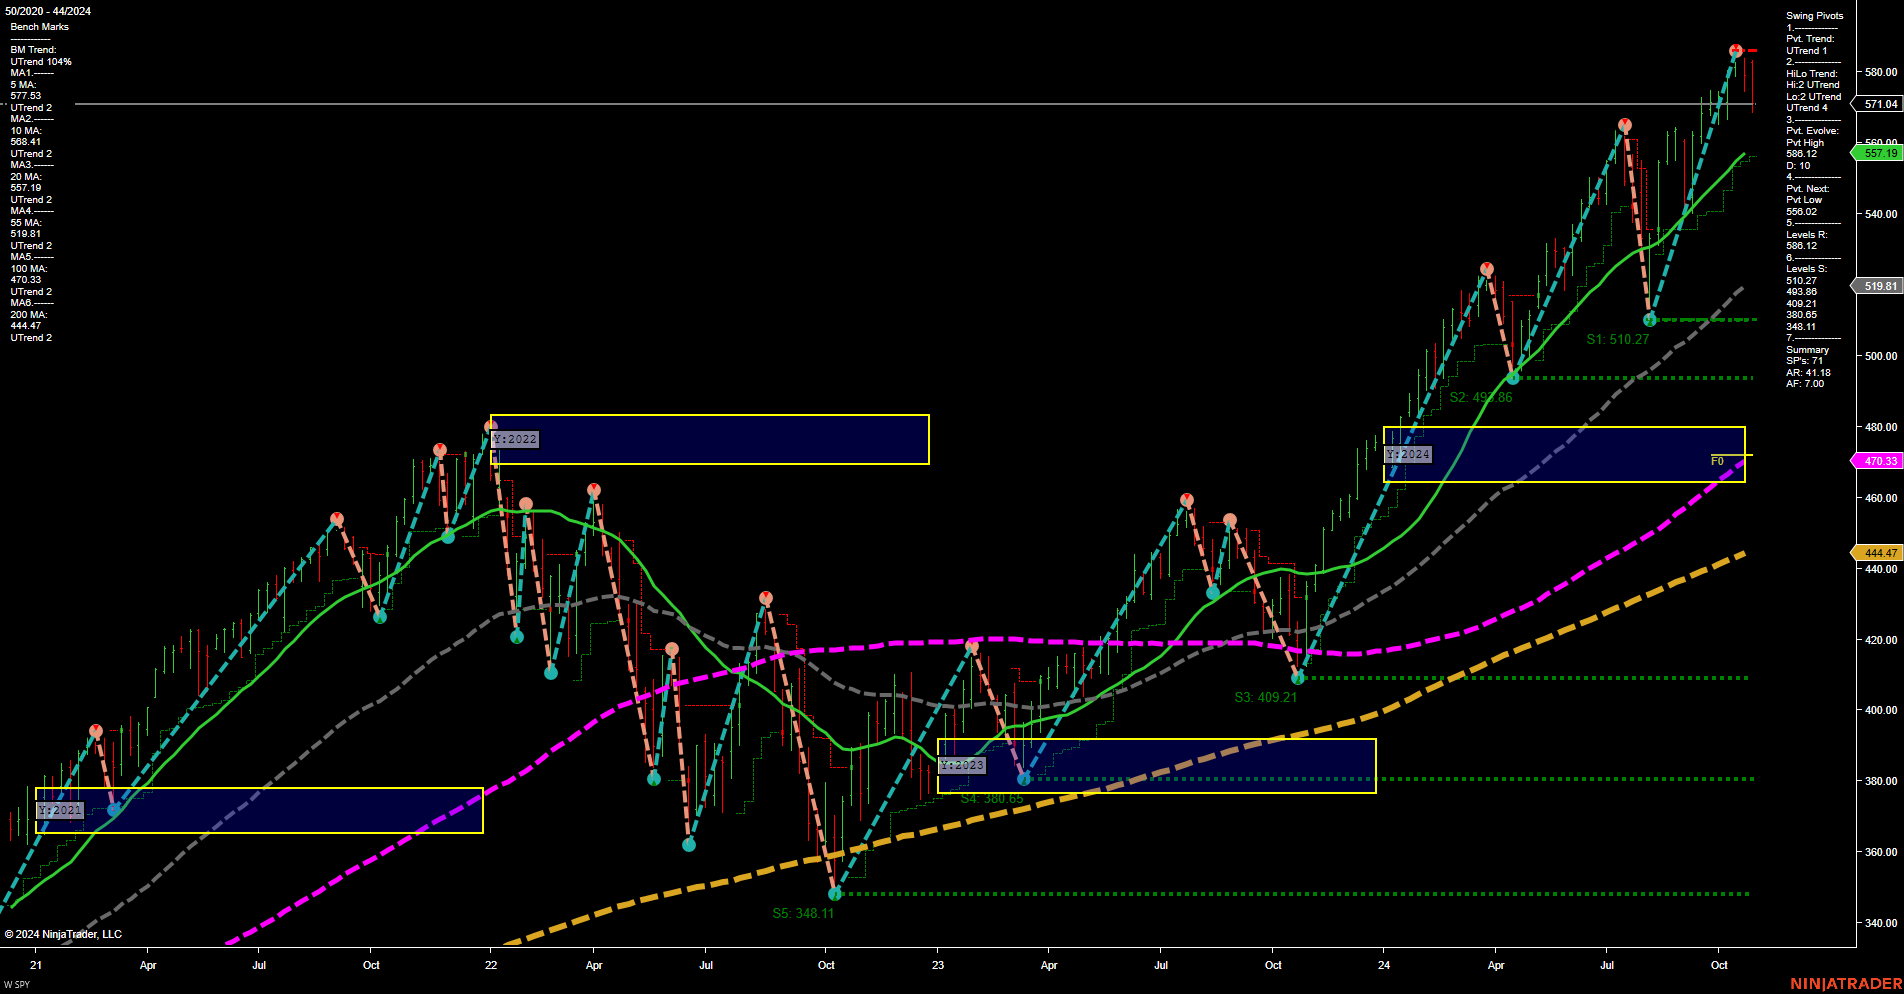
SPY SPDR S&P 500 Weekly Chart Analysis: 2024-Nov-03 18:09 CT
Price Action
- Last: 571.04,
- Bars: Medium,
- Mom: Momentum average.
WSFG Weekly
- Short-Term
- WSFG Current: NA%
- F0%/NTZ' Bias: Price Neutral,
- WSFG Trend: Neutral.
MSFG Month Nov
- Intermediate-Term
- MSFG Current: NA%
- F0%/NTZ' Bias: Price Neutral,
- MSFG Trend: Neutral.
YSFG Year 2024
- Long-Term
- F0%/NTZ' Bias: Price Above,
- YSFG Trend: UTrend,
- YSFG vs Prior YSFG: Open higher.
Swing Pivots
- (Short-Term) 1. Pvt. Trend: UTrend,
- (Intermediate-Term) 2. HiLo Trend: UTrend,
- 3. Pvt. Evolve: Pvt high 556.12,
- 4. Pvt. Next: Pvt low 556.02,
- 5. Levels R: 571.04, 557.19, 550.12,
- 6. Levels S: 510.27, 499.86, 409.21.
Weekly Benchmarks
- (Intermediate-Term) 5 Week: 557.53 Up Trend,
- (Intermediate-Term) 10 Week: 548.21 Up Trend,
- (Long-Term) 20 Week: 510.18 Up Trend,
- (Long-Term) 55 Week: 519.81 Up Trend,
- (Long-Term) 100 Week: 470.33 Up Trend,
- (Long-Term) 200 Week: 444.47 Up Trend.
Overall Rating
- Short-Term: Bullish,
- Intermediate-Term: Bullish,
- Long-Term: Bullish.
Key Insights Summary
The SPY chart shows a strong upward trend across all time frames, with price action above key moving averages and resistance levels. The momentum is average, indicating steady progress. The yearly session fib grid suggests a bullish trend, opening higher than the previous year. Swing pivots confirm an uptrend, with resistance levels being tested. The market appears to be in a continuation phase, with potential for further gains if current support levels hold.
Chart Analysis ATS AI Generated: 2024-11-03 18:09 for Informational use only, not trading advice. Terms and Risk Disclosure Copyright © 2024. Algo Trading Systems LLC.
