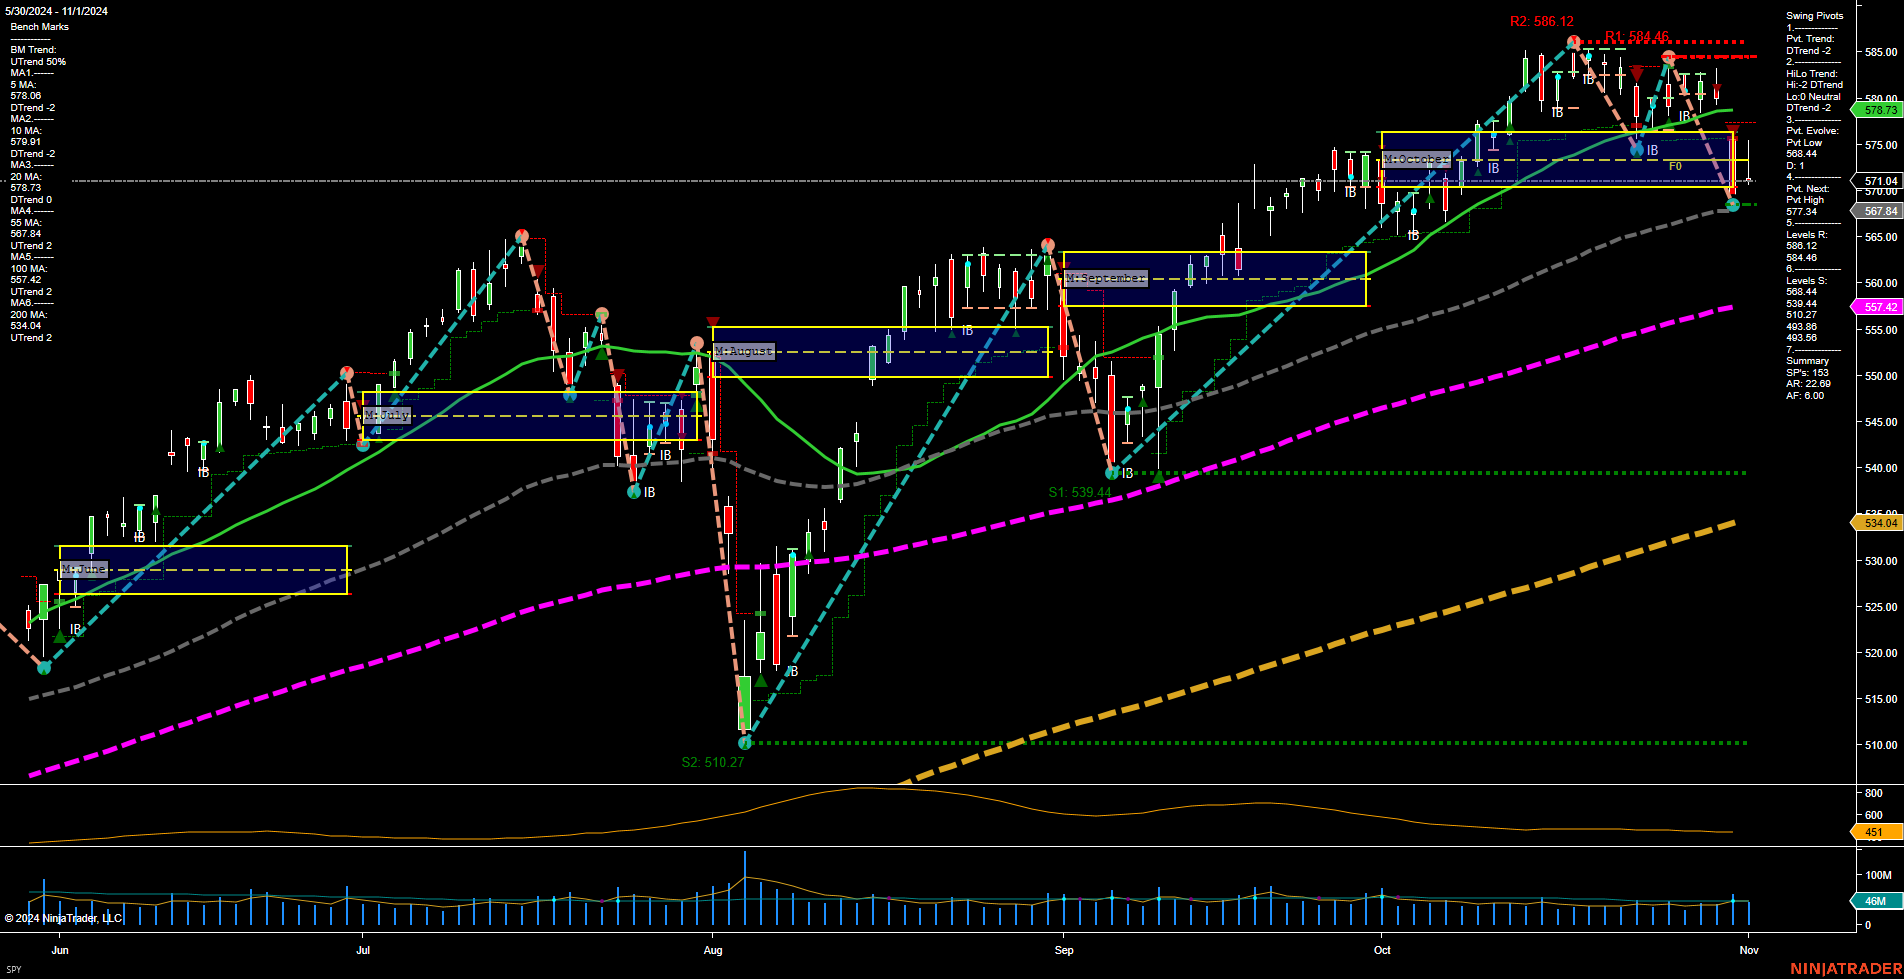
SPY SPDR S&P 500 Daily Chart Analysis: 2024-Nov-03 18:08 CT
Price Action
- Last: 571.04,
- Bars: Medium,
- Mom: Momentum average.
WSFG Weekly
- Short-Term
- WSFG Current: NA%
- F0%/NTZ' Bias: Price Neutral,
- WSFG Trend: Neutral.
MSFG Month Nov
- Intermediate-Term
- MSFG Current: NA%
- F0%/NTZ' Bias: Price Neutral,
- MSFG Trend: Neutral.
- MSFG vs Prior MSFG: Open higher,
Swing Pivots
- (Short-Term) 1. Pvt. Trend: DTrend,
- (Intermediate-Term) 2. HiLo Trend: DTrend,
- 3. Pvt. Evolve: Pvt low 561.44,
- 4. Pvt. Next: Pvt high 585.00,
- 5. Levels R: 586.12, 584.46, 578.73,
- 6. Levels S: 571.04, 567.84, 557.42.
Daily Benchmarks
- (Short-Term) 5 Day: 577.08 Down Trend,
- (Short-Term) 10 Day: 578.73 Down Trend,
- (Intermediate-Term) 20 Day: 567.84 Down Trend,
- (Intermediate-Term) 55 Day: 557.42 Up Trend,
- (Long-Term) 100 Day: 534.04 Up Trend,
- (Long-Term) 200 Day: 493.50 Up Trend.
Additional Metrics
Overall Rating
- Short-Term: Bearish,
- Intermediate-Term: Neutral,
- Long-Term: Bullish.
Key Insights Summary
The SPY chart shows a mixed picture with short-term bearish momentum as indicated by the downtrend in the 5 and 10-day moving averages. Intermediate-term trends are neutral, with the MSFG opening higher but maintaining a neutral bias. Long-term trends remain bullish, supported by the upward trajectory of the 100 and 200-day moving averages. The market is experiencing average momentum with medium-sized bars, suggesting a potential consolidation phase. Key resistance levels are at 586.12 and 584.46, while support is found at 571.04 and 567.84. The ATR indicates moderate volatility, and the volume is relatively high, suggesting active trading. Overall, the market may be in a consolidation phase with potential for a breakout or further retracement.
Chart Analysis ATS AI Generated: 2024-11-03 18:09 for Informational use only, not trading advice. Terms and Risk Disclosure Copyright © 2024. Algo Trading Systems LLC.
