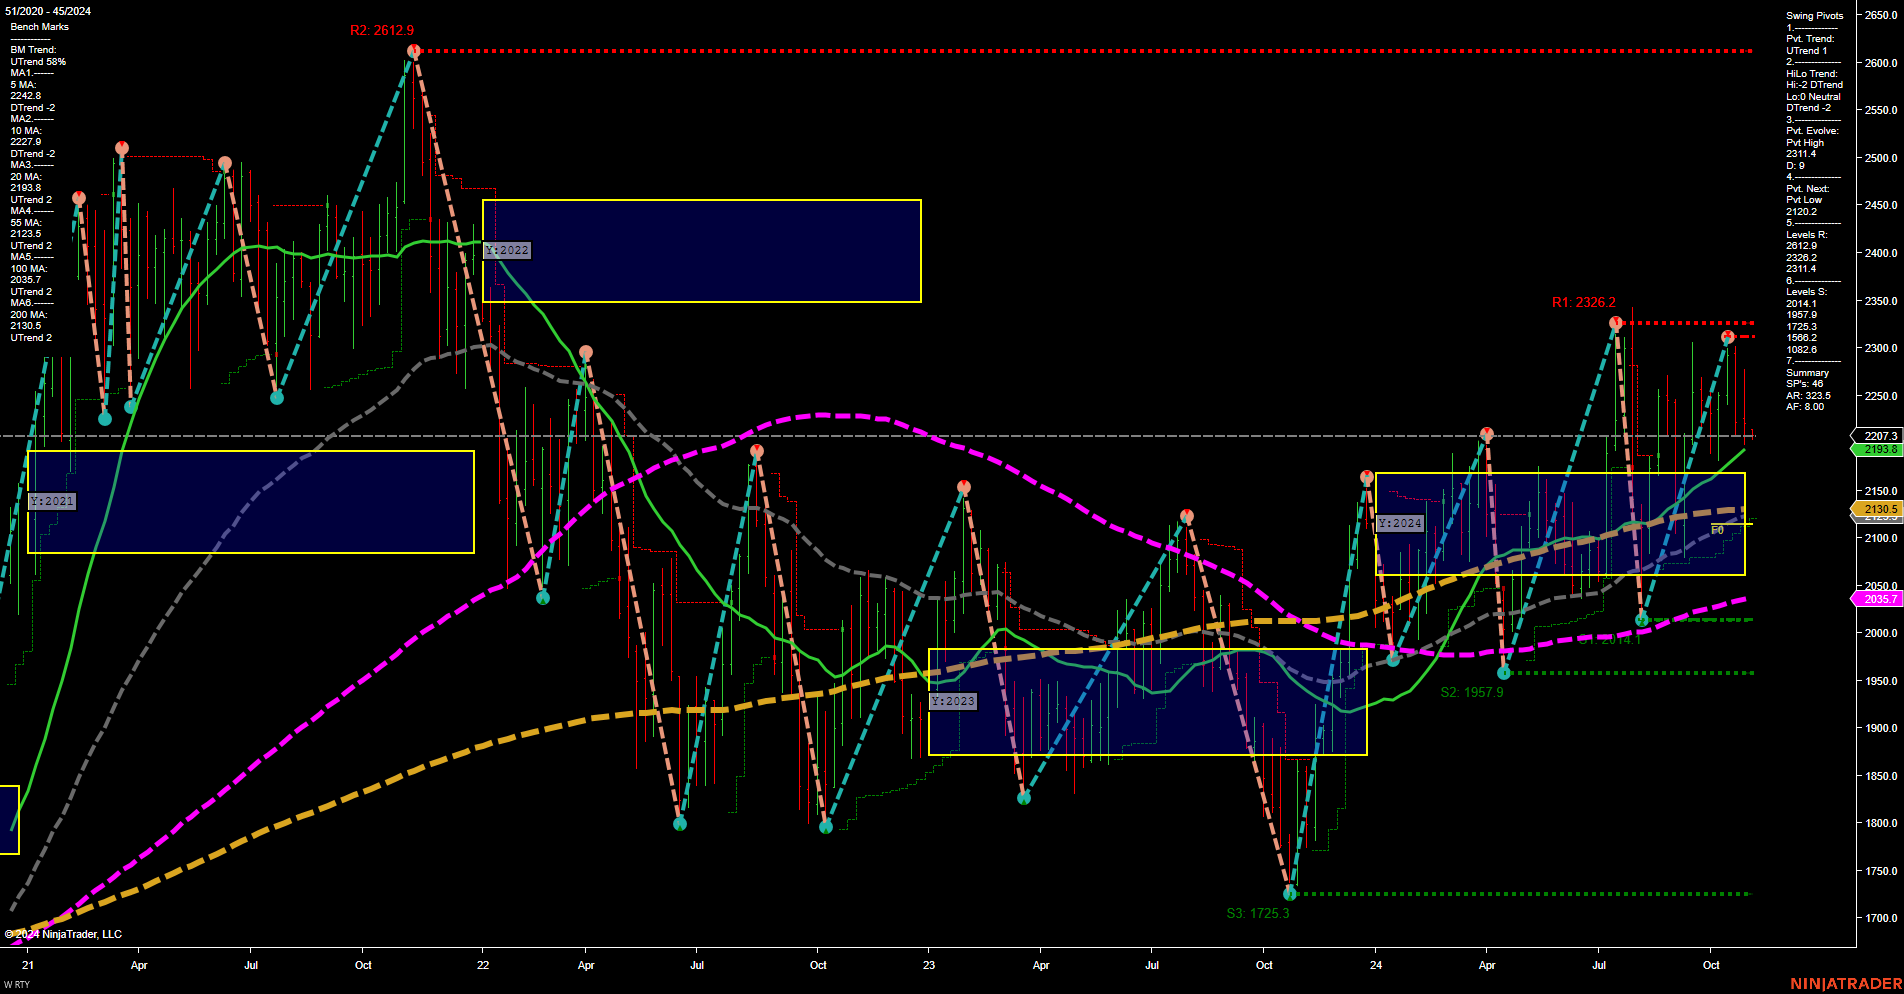
RTY E-mini Russell 2000 Index Futures Weekly Chart Analysis: 2024-Nov-03 18:07 CT
Price Action
- Last: 2193.6,
- Bars: Medium,
- Mom: Momentum average.
WSFG Weekly
- Short-Term
- WSFG Current: -26%
- F0%/NTZ' Bias: Price Below,
- WSFG Trend: Down.
MSFG Month Nov
- Intermediate-Term
- MSFG Current: 1%
- F0%/NTZ' Bias: Price Above,
- MSFG Trend: Up.
YSFG Year 2024
- Long-Term
- F0%/NTZ' Bias: Price Neutral,
- YSFG Trend: UTrend,
- YSFG vs Prior YSFG: Open higher.
Swing Pivots
- (Short-Term) 1. Pvt. Trend: UTrend,
- (Intermediate-Term) 2. HiLo Trend: DTrend,
- 3. Pvt. Evolve: Pvt high 2311.4,
- 4. Pvt. Next: Pvt low 2120.2,
- 5. Levels R: 2326.2, 2311.4,
- 6. Levels S: 2193.6, 2135.0.
Weekly Benchmarks
- (Intermediate-Term) 5 Week: 2193.6 Up Trend,
- (Intermediate-Term) 10 Week: 2135.0 Up Trend,
- (Long-Term) 20 Week: 2073.7 Up Trend,
- (Long-Term) 55 Week: 2053.7 Down Trend,
- (Long-Term) 100 Week: 2068.2 Down Trend,
- (Long-Term) 200 Week: 2130.5 Down Trend.
Recent Trade Signals
- 01 Nov 2024: Long RTY 12-24 @ 2234.2 Signals.USAR-WSFG
- 31 Oct 2024: Short RTY 12-24 @ 2225.3 Signals.USAR.TR120
Overall Rating
- Short-Term: Neutral,
- Intermediate-Term: Bullish,
- Long-Term: Neutral.
Key Insights Summary
The RTY E-mini Russell 2000 Index Futures show a mixed picture with short-term momentum being average and a neutral overall rating. The weekly session fib grid indicates a downward trend, while the monthly session shows an upward trend, suggesting potential for intermediate-term bullishness. Long-term trends remain neutral, with price action showing consolidation around key support and resistance levels. Recent trade signals reflect this mixed sentiment, with both long and short positions being triggered. The market appears to be in a phase of consolidation, with potential for breakout or further consolidation depending on upcoming market conditions.
Chart Analysis ATS AI Generated: 2024-11-03 18:07 for Informational use only, not trading advice. Terms and Risk Disclosure Copyright © 2024. Algo Trading Systems LLC.
